
The goal of this lab exercise was to determine the IV-diagram for many light emitting diodes (LEDs) of different colors and sizes. A source meter unit(SMU, Keithley 2600 Series) was used to apply a voltage over the diode and to measure the corresponding current flow. A python script controlled the SMU, calibrated the channels, swept the voltage and saved the measured data in output files and plots. Out of the IV-curves an estimation for the reverse bias saturation current can be done.
A diode is a nonlinear device. The current to voltage characteristic can be described with the Shockley equation:
\begin{equation} I = I_S \cdot (e^{\frac{V}{N \cdot V_{Temp}}}-1) \end{equation}
where $I$ is the diode current, $V$ the diode voltage, $I_S$ is the reverse bias saturation current, $N$ the nonideality factor and $V_{Temp}$ the thermal voltage ($k_B T/e$).
To get the characteristics of any diode, one has to do a voltage sweep and measure the current. It is important to limit the current in the SMU, because for increasing voltages
in forward bias, the current increases exponentially and the LEDs can only dissipate a limited amount of power, too high currents therefore would destroy the LEDs. The used python script is shown below.
This script sweeps the voltage in a range from -1 V to 3 V, so forward bias and reverse bias are measured together. As the SMU has different ranges for its current measurement, the script does a measurement for each different range, as lower measurement ranges yield higher resolutions.
This picture shows the I/V characteristics of a blue LED, both reverse and forward bias. 6 different measurement ranges are displayed. The higher resolution for smaller measurement ranges leads to a lower noise floor (a factor of 1000) for small signals. However, it is impossible to measure large currents with a small measurement range, therefore the larger ranges are needed as well. To exclude the possibility that the measured current is just noise, a reference measurement, where the an open circuit is measured, could be done and compared.
The raw data for this plot is listed here:
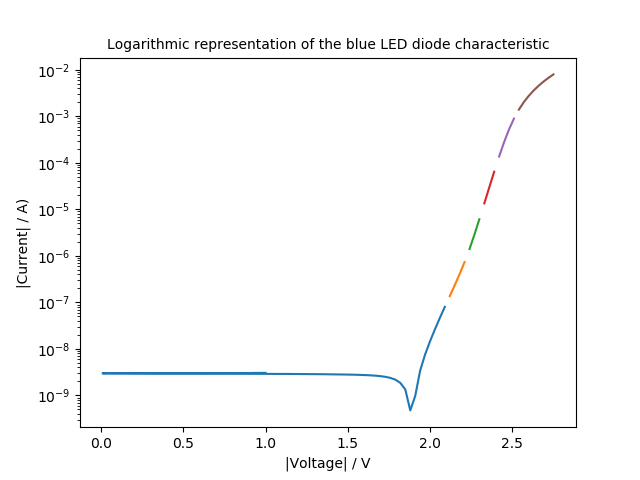
As this is a logarithmic plot, negative values cannot be represented, so the absolute value of the current is plotted.
The spike at around 2 V represents the point, where the current changes its sign. However when looking at the diode equation
one can see that the current should be 0 A for a voltage of 0 V. Our data does not show this behaviour. This
is a result of the occuring photoelectric effect, which creates a photocurrent due to ambient light hitting the
pn-junction. This photocurrent adds up to the diode current and shifts the zero point to positive voltages.
When examining the forward bias, the current is no straight line in the log plot, but rather seems to consist of two
different slopes. One could use this information to calculate the nonideality factor N of the diode equation for this
diode. At higher currents, the series resistance of the diode has a bigger impact, therefore the gradient decreases.
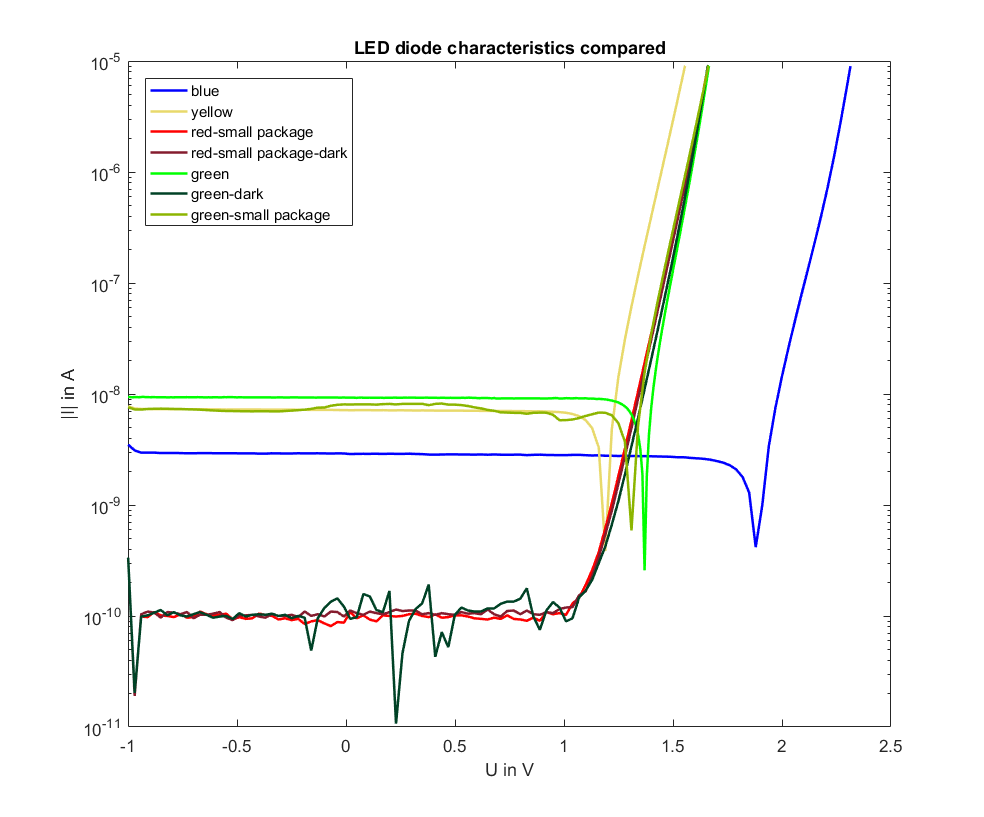
Now the measured light emitting diode characteristics are compared to one another. To make a useful comparison, only the data from one specific measurement range (1e-05_a) is plotted for each diode.
The raw data for this plot can be seen here:
There are two possibilities to determine the saturation current for each diode. One initial guess can be the data in reverse bias.
But a more exact result is yielded via linear fitting the forward bias data.
To get a better idea on the impact of the ambient light on the diode characteristics, more measurements should be done on the dark
and compared to those with ambient light.