
Output characteristic of n-channel MOSFET
The curves show a almost linear behaviour at small drain-sourve voltages and saturaterd behaviour at higher values.
commons.wikimedia.org/wiki/File:MOSFET-Kennlinie.svg
In this report, I will give you an introduction into the measurement of MOSFET output characteristics. The measurement will be automated using a Python script that controls a sourcemeter, namely Keithley 2600 Series Sourcemeter .
The basic idea is to use the Sourcemeter as a power supply and measure the Drain-Source-current while applying different Gate-voltages. A more detailed description of an n-channel MOSFET can be found in the lecture notes from Semiconductor Devices (see also Wikipedia MOSFET).
The desired result should look like the curves in the figure above. At low drain-source voltages, the transistor behaves like an ohmic resistor and has a linear response. For higher voltages the drain-source current saturates.
The datasheet for the transistor (n-channel MOSFET ZVN2110A) can be found here. According to that, the transistor has a maximum gate source voltage of \( \pm 20~\text{V} \) and a maximum drain-source voltage of 100 V. The threshold voltages has a range of 0.8 to 2.4 V, so for our measurements we choose this range and a drain-source voltage from 0 to 10 V.
This script requires the Keithley 2600 Python library. Make sure to replace the IP address in the script with the correct one for the SMU. For the measurement, channel A of the Sourcemeter was connected to drain and source, and channel B was connected to gate.
At first, the measurement was done without high accuracy, thats why the measured points showed strange behaviour. The settings were changed for high accuracy for all further measurements. The plot below shows the combined measurement results for different gate voltages. The curves show the linear response and the saturation at higher voltages. The non-linear curve for the hightes gate voltage is untypical and also not shown in the data sheet. Further investigations could be done to explain this behaviour.
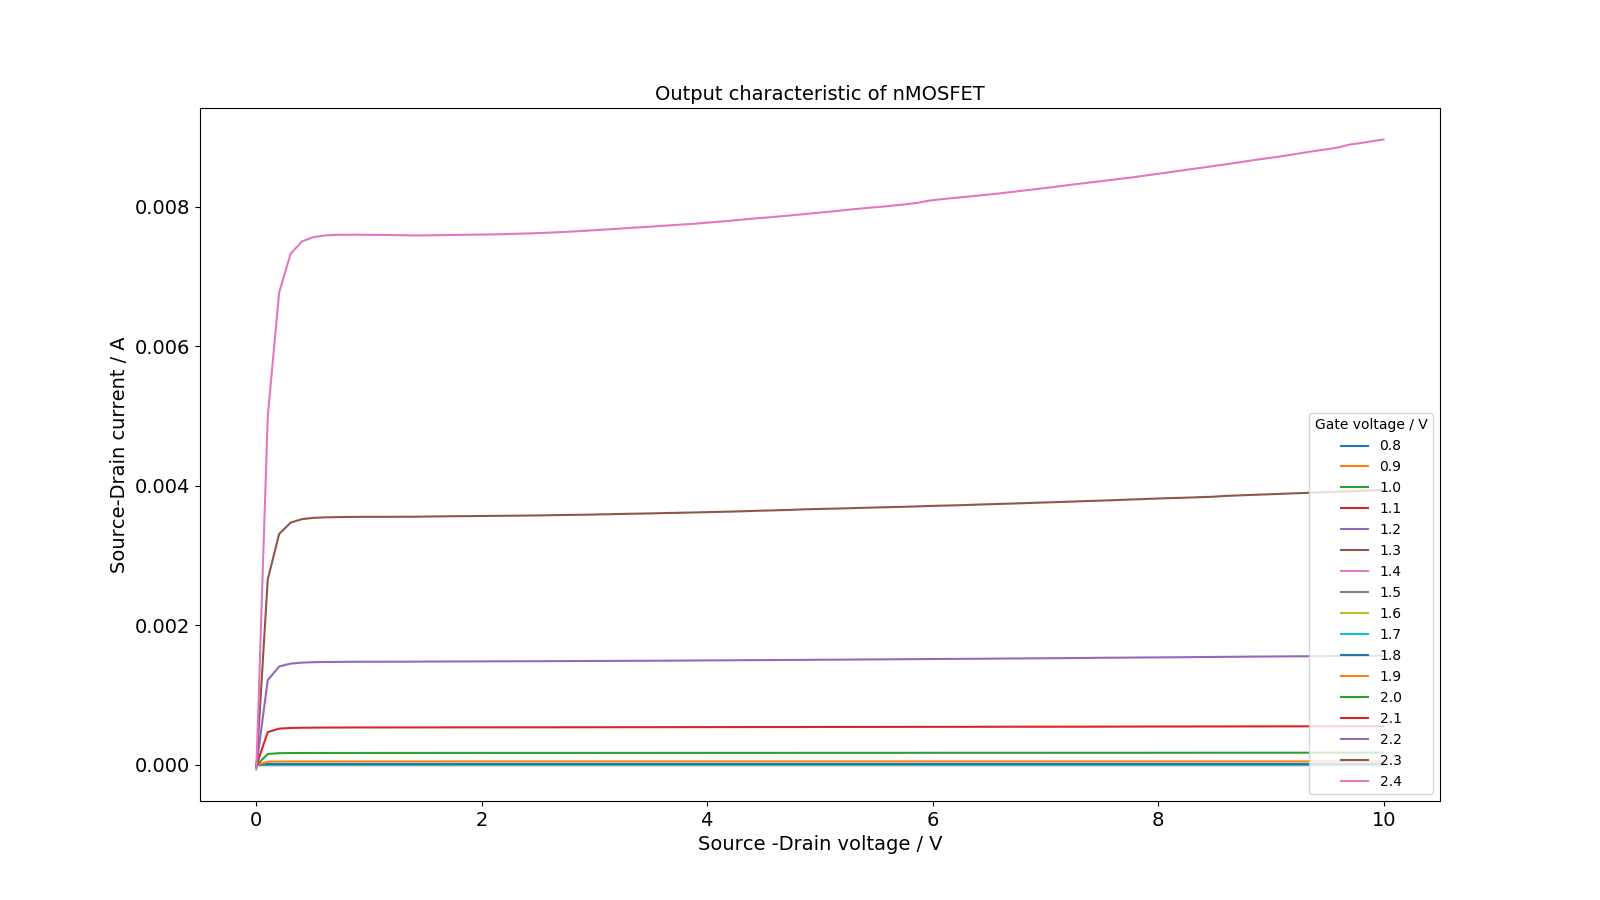
Measured output characteristics for n-MOSFET
Drain-source current depending on the drain-source (DS) voltage for different gate
voltages.
At low DS-voltages the curves show linear behaviour while at higher
voltages the curves flatten out.