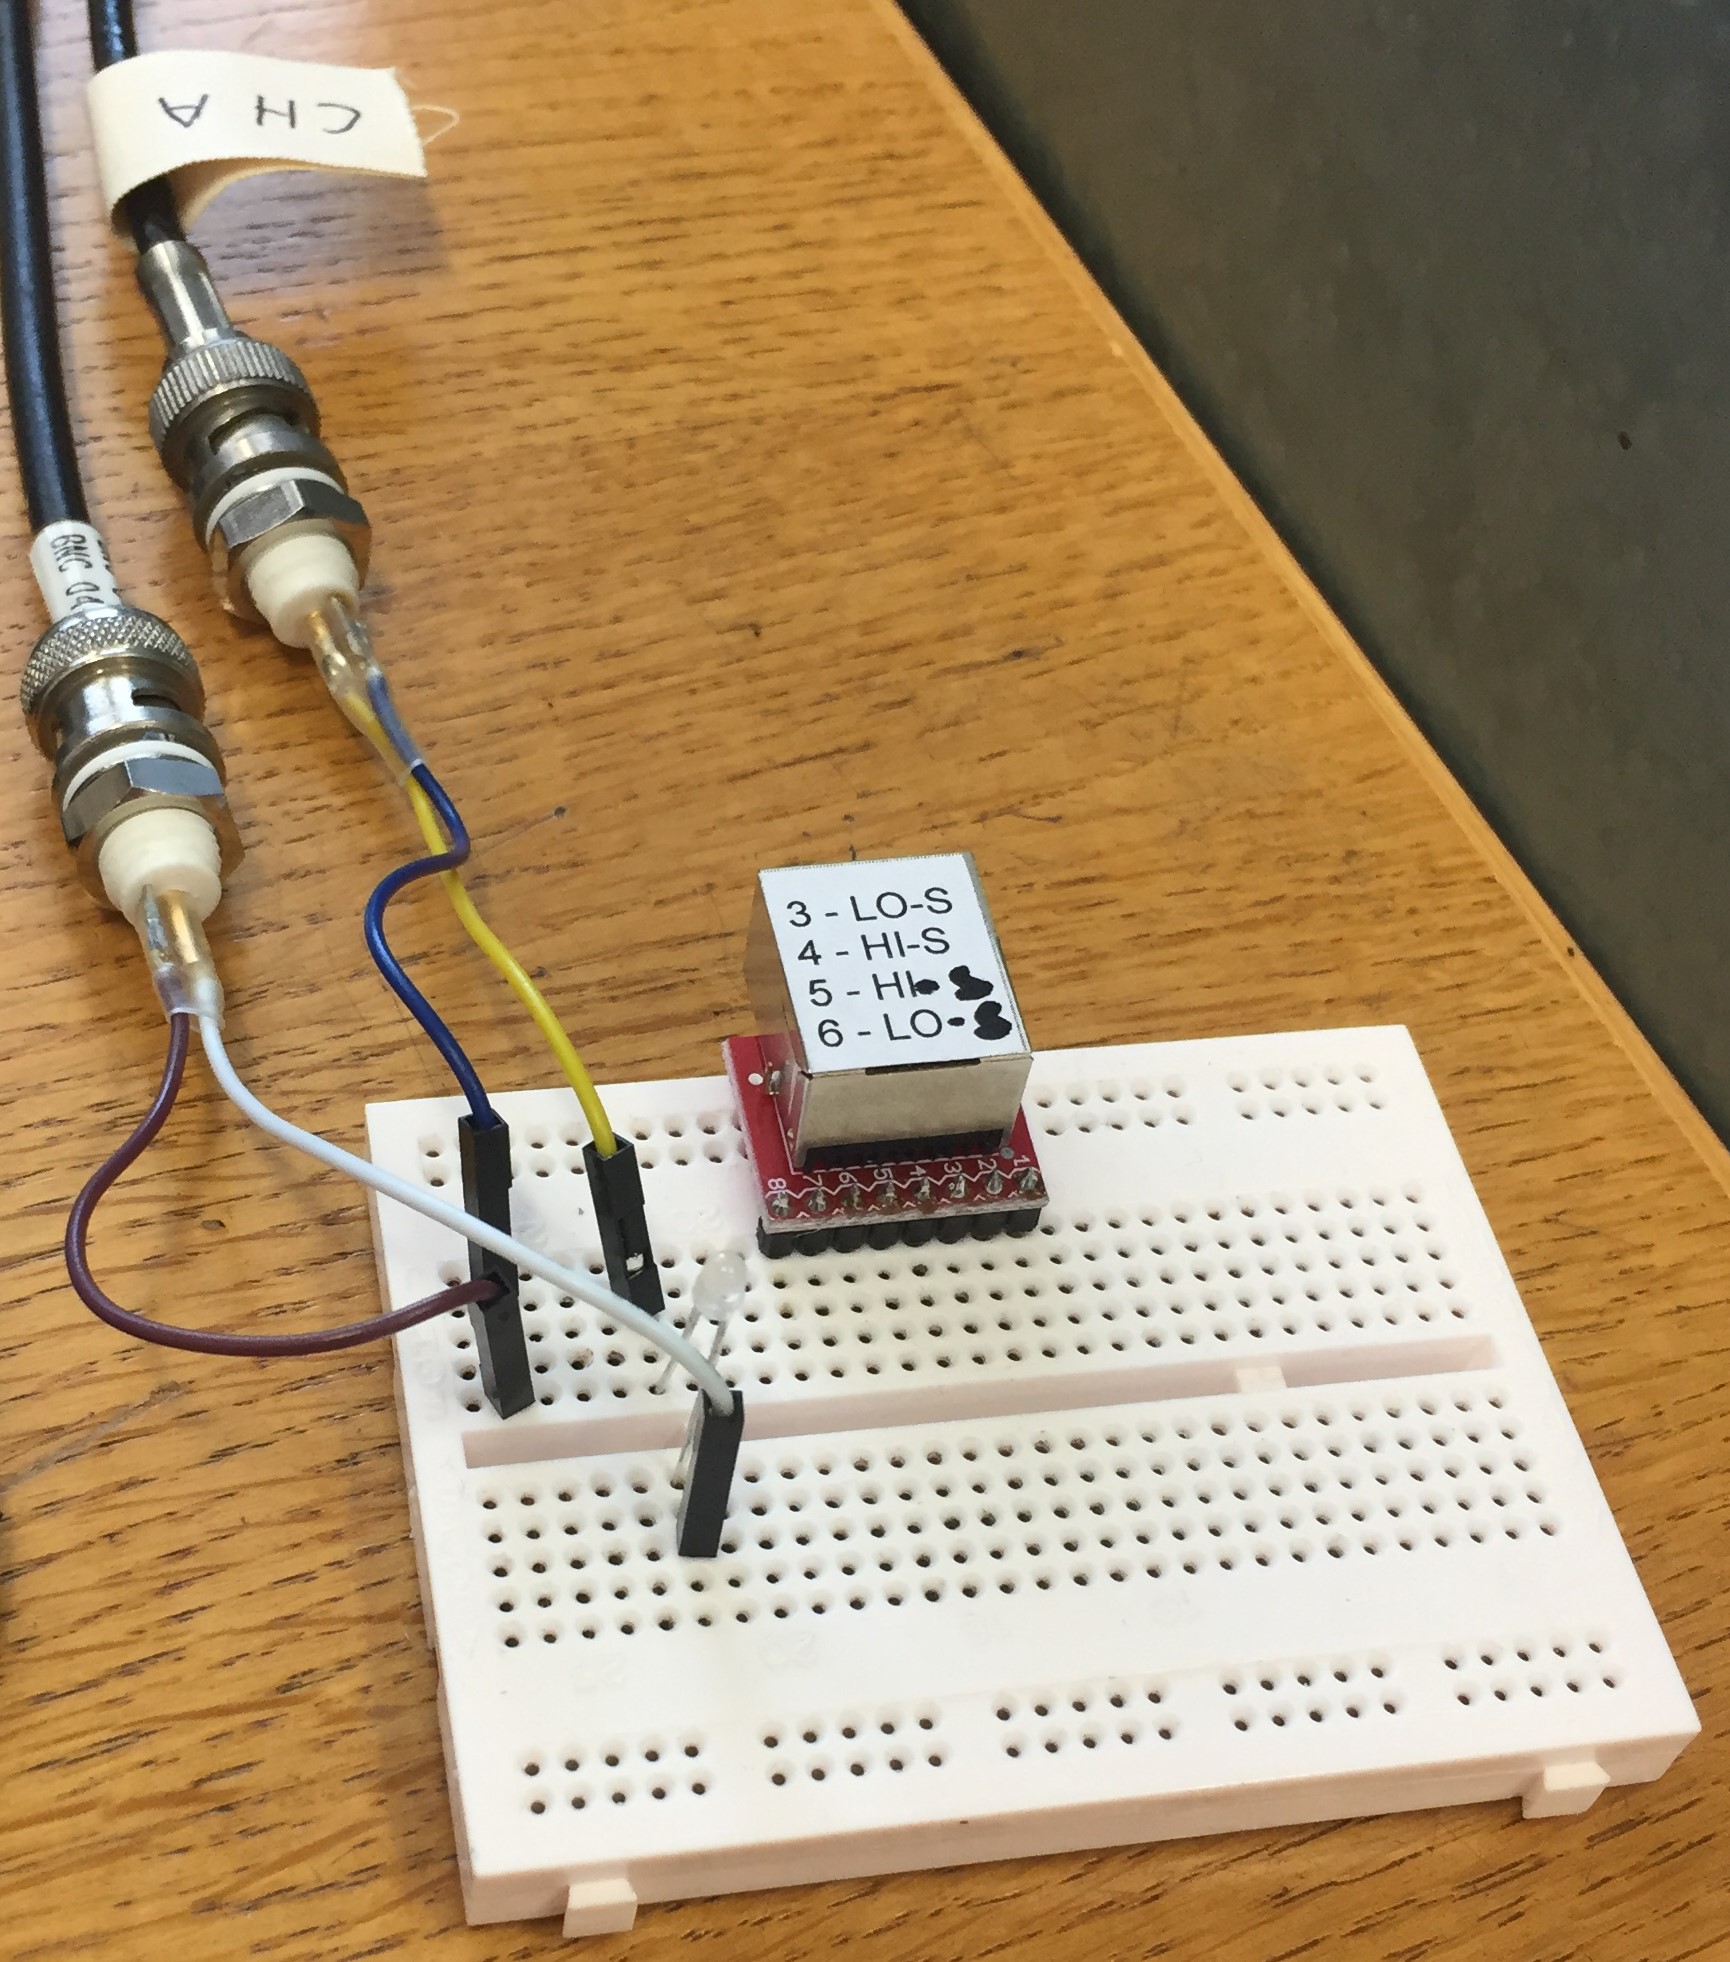
The goal of this exercise was to characterize a two-color LED by measuring its voltage-current characteristic curve and with that information gathered calculate its quality factor (defined below). The measurements were all done with a Keithley 2600 series sourcemeter connected to a PC and controlled with a Python script. A sourcemeter is an instrument that has the capability of simultaneously acting as a voltage/current source and as a volt-/ammeter (measured at the same time). Using this features, the characteristic curve of a (light emitting) diode is easily measured. The experimental setup can be seen in the following Fig. 1:
To control the sourcemeter it was plugged in the LAN with an ethernet-cable; the communication took place via a Python script (an additional library provided by Keithley was needed for communication). The code can be seen below; in short it initialized the communication with the sourcemeter, sweeped through a pre-defined voltage regime and measured current and voltage simultaneously. Additional information is found within the code in the form of comments:
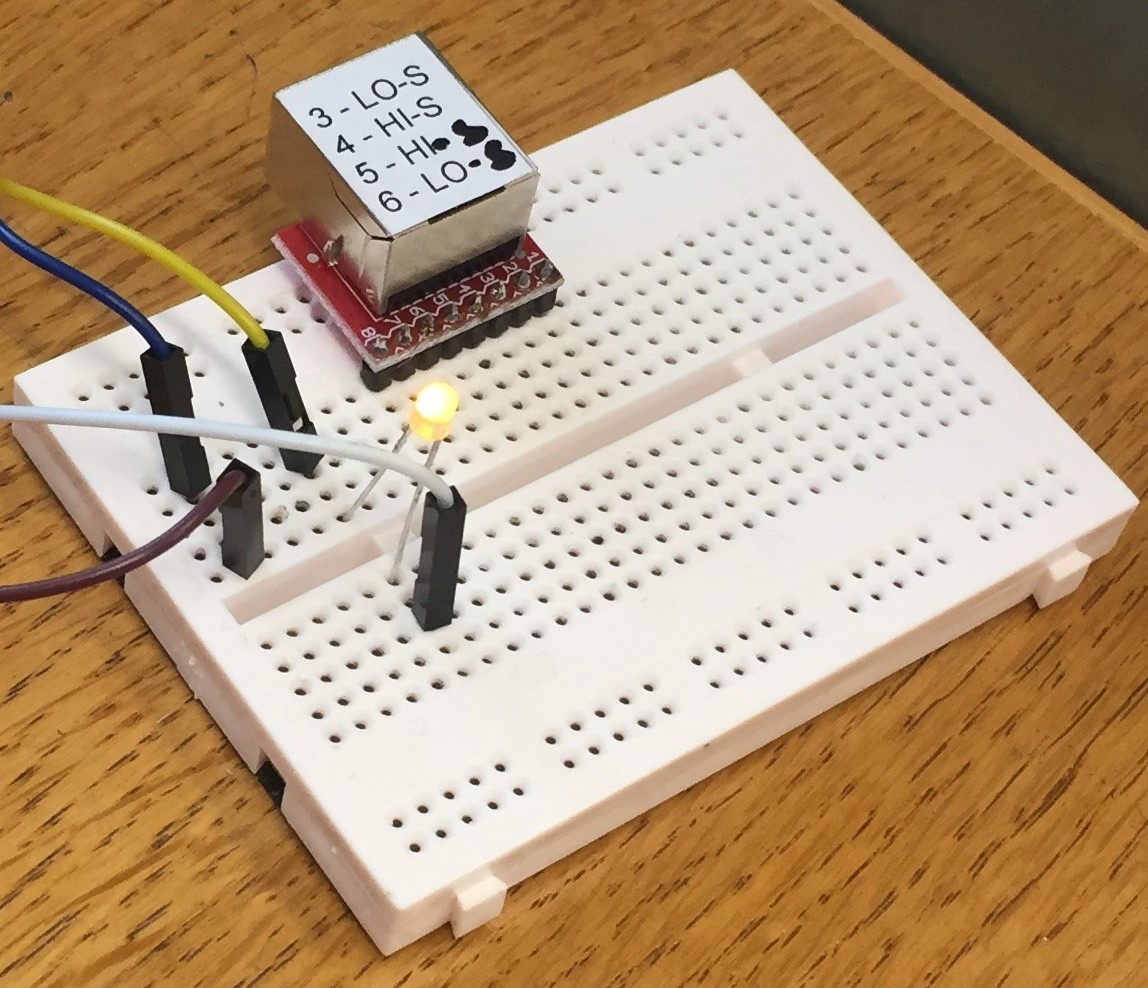
Due to the two-color nature of the light emitting diode (in fact: two different LED's in an antiparallel circuit were assumed) a current flow was measured at negative as well as positive voltages. The two colors of the LED can be seen in the following Fig. 2:
 |
 |
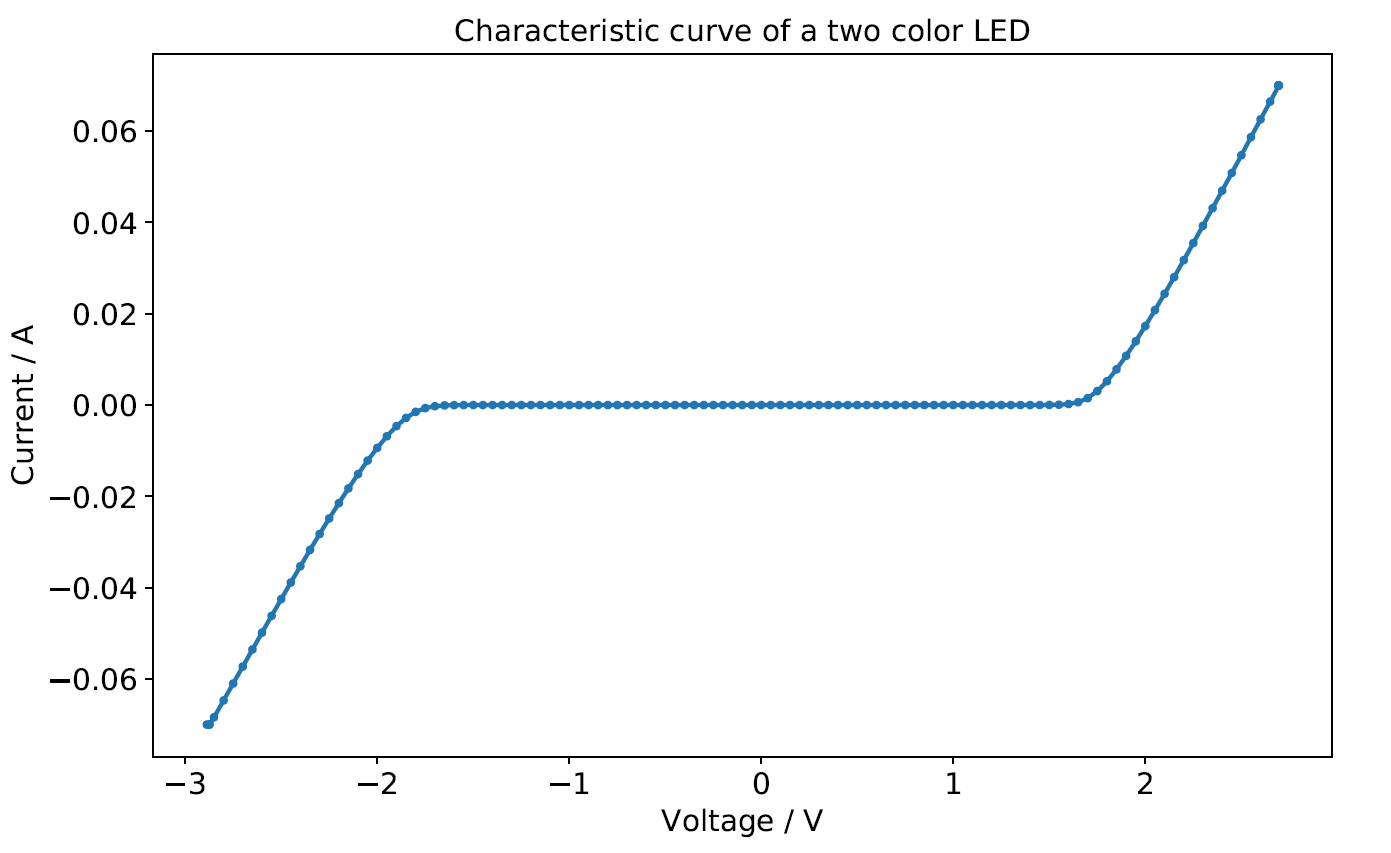
The characteristic curve was measured in two different conditions: darkened and in sunlight. The reason for the darkening was to minimize photoinduced electron-hole pair generation (higher threshold voltage). In between those two measurements just slight differences were observed, as can be seen in the following Fig. 3:
 |
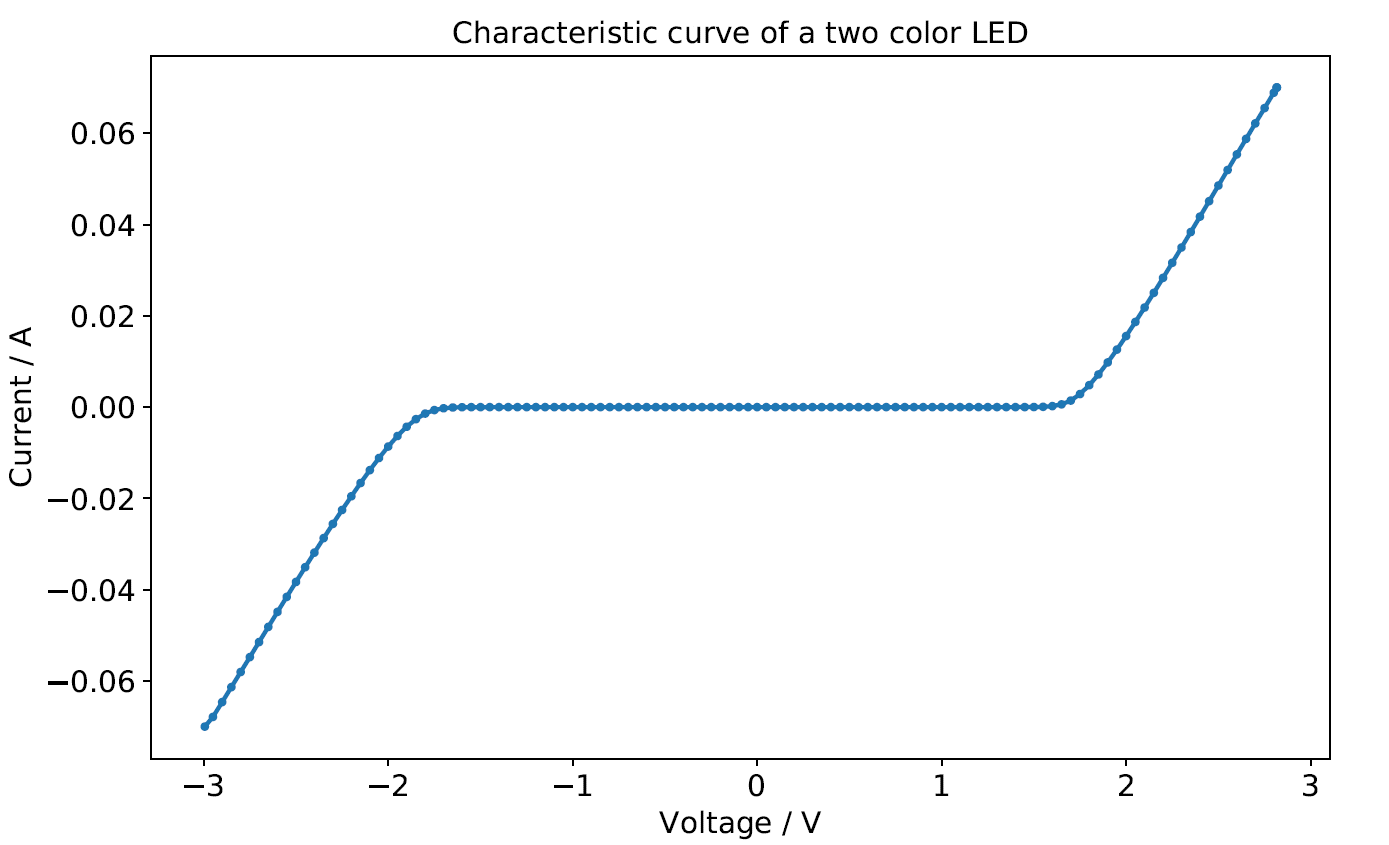 |
The current increase in both directions should be exponential (see Shockley-equation below) but in this case seems to be quite linear. That may play a role in determining the quality factor in the next section.
For the calculations in this section the values of the darkened measurements were taken into account. The current-voltage characteristic of a diode can be described by the Shockley diode equation: \begin{equation} I(V) = I_S*(\exp{(\frac{e*V}{\eta*k_B*T})}-1) \end{equation} $I(V)$ is the (forward) current in relation to the (forward) voltage, $I_s$ is the threshold current, $e$ the elementary charge, $V$ the voltage, $\eta$ the ideality factor, $k_B$ the Boltzmann constant and $T$ the temperature. If the exponential in this formula is much greater than 1, one can take the logarithm of this equation and gather the following relation: \begin{equation} \ln{I} = \ln{I_S}+\frac{e*V}{\eta*k_B*T} \end{equation} By plotting the curve in a semilogarithmic manner and fitting the linear relation above, one can determine the ideality factor η (measure for the quality of the diode). The code for creating a semilogarithmic plot and fitting the linear relation can be seen below (additional information as comments):
The abovementioned fit can be seen in the following figure (T ~ 300 K):
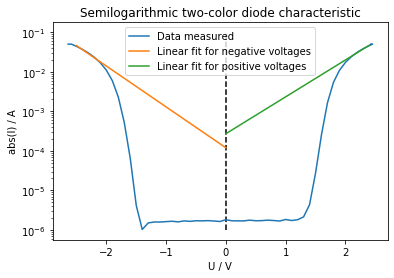
This linear fit gave the following results (ln(Is) is the intercept):
\begin{equation}
I_S(yellow) = 119,5~\mathrm{\mu A}\\
I_S(red) = 271,7~\mathrm{\mu A}
\end{equation}
These values are relatively high for typical light emitting diodes, the reason for that my be a low-quality fit caused by little values in the higher voltage regime. Using the slope of the fits the ideality factor could be calculated:
\begin{equation}
\eta (yellow) = 16,24\\
\eta (red) = 18,01
\end{equation}
These values are too high by one order of magnitude, the reason for this is most probably the unwanted addition of a linear resistance in the measurement of the characteristic curve. It is not particularly easy to resolve this issue; however, the following approach was utilized:
1. Assume that a linear resistor R is disturbing the electrical circuit.
2. Make a linear fit of the current in relation to the voltage starting at 2 V - this is where the "linear" part begins (assumption: LED has no resistance, just a potential drop of 2 V occurs)
3. Calculate the resistance from the fit parameters (1/slope) - that gives a value of about 13 Ω
4. Construct a relation between voltage (differs between LED and R) and current (is the same):
\begin{equation}
U(I) = I*R+\ln{(\frac{I}{I_S}+1)}*\frac{\eta*k_B*T}{e}
\end{equation}
The second term is the inverse Shockley equation.
5. Fit the positive half of the voltage-current characteristic with this relation and Python and obtain the following results for the quality factor:
\begin{equation}
\eta (yellow) = 5,800\\
\eta (red) = 3,867
\end{equation}
Again, thinking of the fact that the quality factor should be between 1 and 2, these results differ significantly. However, they seem to be more realistic than the ones acquired before. The reason for the deviations of these results may be the fact that in caclulating them, many simplifications were made.