In this laboratory course various electronic properties of a red light emitting diode (LED) were measured. Aim of this these experiments was to become acquainted with the use of a sourcemeter unit (SMU) Keithley 2600 Series Sourcemeter), with the remote controll of the SMU with Python scripts and to draw conclusions about the measured device from the collected data. For further information about the atomic processes taking place in an LED, it is refered to the Physics of Semiconductors course from Prof. Hadley.
As part of this laboratory session the following three measurements were performed on a red LED:
In this measurement the following Python script was used to record the characteristic curve of the red LED. This script operates the SMU as a voltage source and performs a voltage sweep, while recording the current that flows through the LED. To use this script the Keithley 2600 Python library has to be stored in the same folder as the script. Furthermore it has to be made sure, that the correct channel of the SMU is connected to the LED.
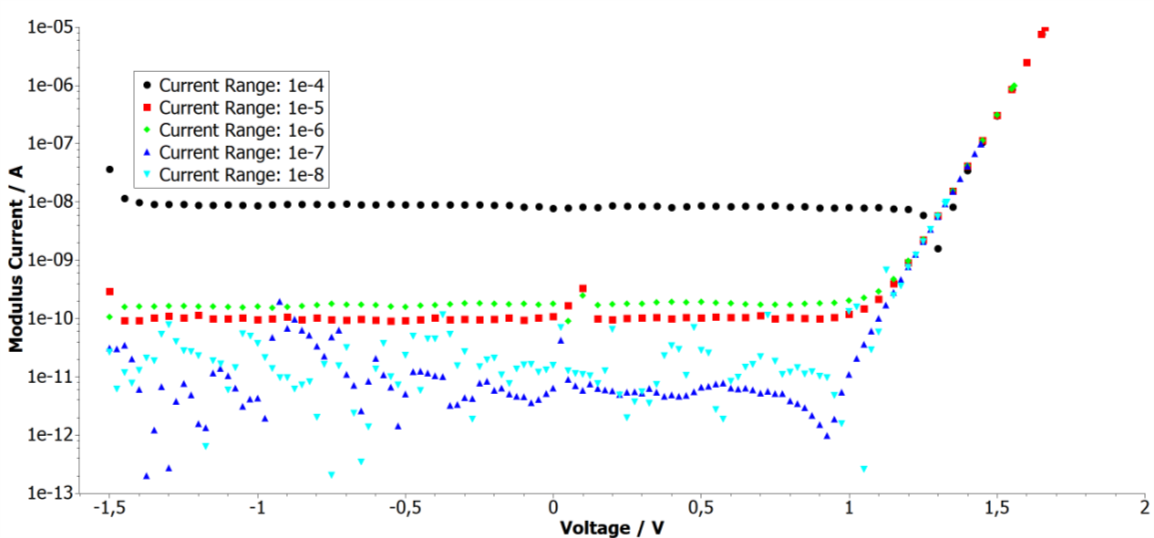
With this programm the diodes U/I curve was measured for different current ranges. The results are shown in the following plot.
This picture shows the U/I characteristics of the red LED for different current ranges of the SMU. The measurement shows the impact of the current range on the recieved data. High current ranges usually are used to measure higher currents, but with the tradeoff that they sacrifice resolution for lower currents. For the current ranges 1e-4 to 1e-6 clearly the lower end of the measurement range was hit, which lead to this data. For the current ranges 1e-7 and 1e-8 a comparison of the low voltage and reverse voltage behaviour with other diodes could be performed to evaluate the influence of the SMU on the measurement. Furthermore the photoelectric effect should be detectable when operating the LED next to a window on a bright day. Some experiments dedicated to this effect could be performed.
The raw data for this plot can be seen here:
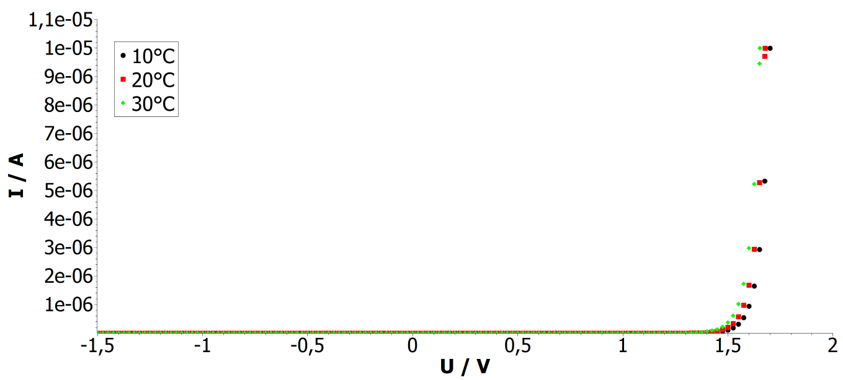
An interesting feature of semiconductor devices is that their current-voltage-characteristic is temperature dependend. To show this dependence the LED was put into the (Vötsch VT4002 climate chamber(again both the Keithley 2600 Python library and the Vötsch VT4002 Python library have to be stored in the same folder as the Pyhton scripts). The following script performs a temperature sweep and when a predefined temperature is reached, the diode characteristic is recorded.
The characterisitc curves for the temperatures 10°C, 20°C and 30°C are shown in the figure below:
The raw data for this plot can be seen here:
An intersting analysis of this measurement would be the operating temperature of the diode. Therefore the step size of the voltage sweep should be decreased to get more data points for higher voltages. With this additional data a comparision to the next measurement could be performed and the operating temperature could be estimated.
In the temperature sweep programm also a second measurement is implemented. This second measurement operates the SMU in current mode and measures the voltage that is needed to drive a predefined bias current of 1e-6 A through the LED for different temperatures. The results of this temperature sweep are shown in the following figure:
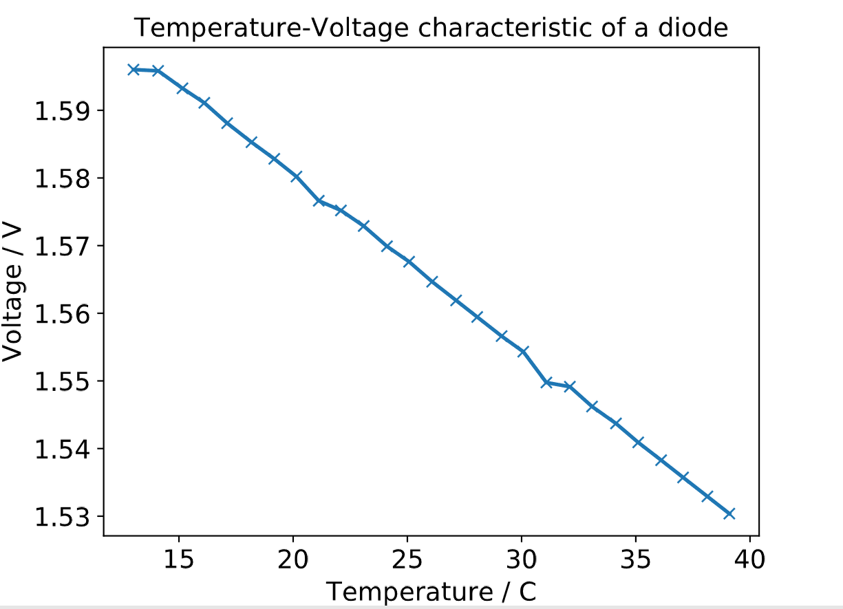
As expected with a higher divice temperature less voltage is needed to drive the same current through the LED.
Possible extensions of these measurements