This page describes how to measure the characteristics of a n-channel MOSFET. Some basic information about the structure of MOSFETs can be found here: How does a MOSFET work? The following MOSFET was characterized: Datasheet IRF840A
In this experiments a Keithley 2600 Series Sourcemeter was used.
The Measurements were performed at ambient conditions and room temperature: T = (23,0±0,5)°C
First the output characteristics were measured for different Gate Voltages, using the python code shown below. The MOSFET was connected the following way: SMUA und SMUB Low on Source, SMUA High on Gate and SMUB High on Drain.
This script requires the Keithley 2600 Python library. Save this in your working directory.
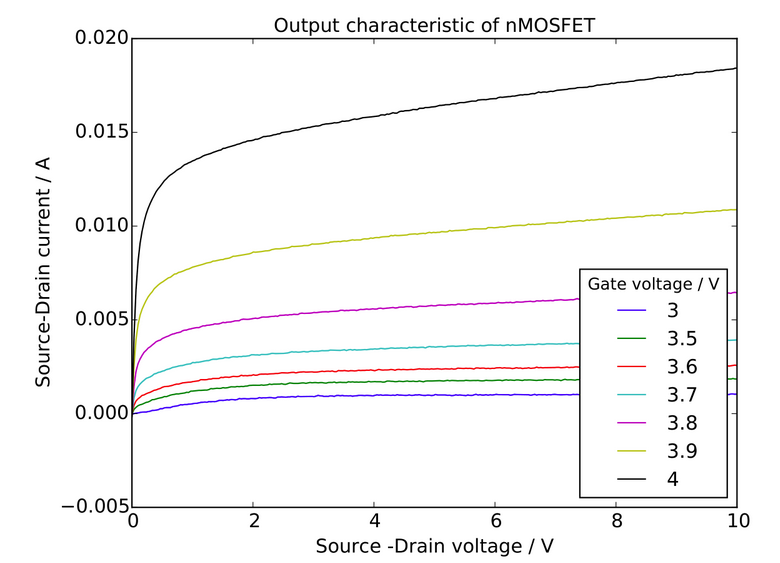
As can be seen in the figure below, a higher Gate voltage results in a higher Source-Drain current. At low Source:Drain voltage a exponential growth can be observed, which flatten for higher voltages. This change marks the saturation region of the n-channel MOSFET.

Next the transfer characteristics were measured for different Drain-Source Voltages, using the python code shown below. To do so, the MOSFET was connected in the same way as before: SMUA und SMUB Low on Source, SMUA High on Gate and SMUB High on Drain.
This script requires the Keithley 2600 Python library. Save this in your working directory.
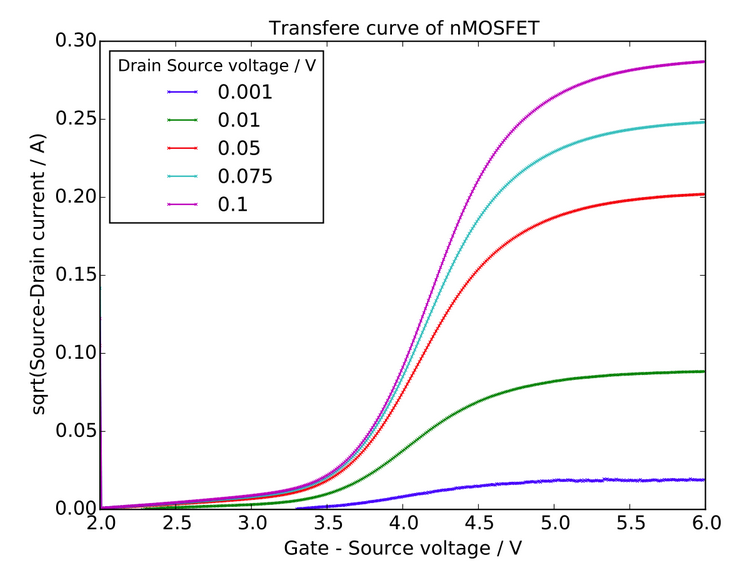
In the figure shown below, the square root of the Source-Drain current is shown as a function of the Gate-Source voltage at different Drain-Source voltage. At first, a steep exponential increase can be observed at around 3,5-4,5 V (Gate-Source voltage). Followed by a flattened curve for higher voltages, marking the saturation region.

Data
The measured data is given in the textbox below. The first column is Gate – Source voltage in V and the second column is the sqaure root of the Source-Drain current in A for a Drain-Source voltage of 0.001 V. Then respected columns of voltage (in V) and current follow for increasing Drain-Source voltage: 0.01 V, 0.05 V, 0.075 V, 0.1 V.