The goal of this excercise is to study avalanche breakdown in Semiconductor devices. The objective was to classify Breakdown Voltage in diodes as a way of calculating the doping concentration of a heavily doped side. For the measurements, Keithley 2600 Series Sourcemeter was used to record the current-voltage characteristics. The sourcemeter was controlled using a python script that sweeps the voltages and saves the obtained data. In addition, the data as well as the python script were uploaded to eLab. Some helpful information on how to get started with python can be found here.
In pn-junctions, as the width of the depletion layer increases under reverse bias, the electric field increases. Free carriers in the depletion region are accelerated by this electric field. If they acquire enough energy to scatter an electron from the valence band to the conduction band, more electron-hole pairs are generated. These newly generated charge carriers also get accelerated and this leads to an avalanche effect.
The Breakdown Voltage can be modeled from abrupt junction(J.L. Hudgins, G.S. Simin, E. Santi, M.A. Khan, An assessment of wide bandgap semiconductors for power devices, IEEE Transactions on Power Electronics ( Volume: 18, Issue: 3, May 2003) .). The traditional way of calculating this value is,
$$V_B = 5.2\times 10^{13}N_B^{-3/4}E_G^{3/2}$$where $E_G$ is the bandgap energy and $N_B$ is the doping of the lightly doped side. A different, more advanced model of breakdown voltage gives a different equation that includes some fitting parameters $a$, $n$ and the electrical permitivity.
$$V_B = 2.76\times 10^{5}\epsilon_{r}a^{2}N_B^{-1}E_G^{2n}$$For light emitting diodes of direct bandgap, $a = 1.7348$ and $n = 2.506$. The bandgap energy can be deduced for light emmitting diodes from their wavelength. The photon is emmited with the precise energy of the bandgap for direct bandgap, and we can use the expresion $E_G = \frac{hc}{\lambda}$ to deduce the bandgap. This would provide a method to calculate doping concentrations.
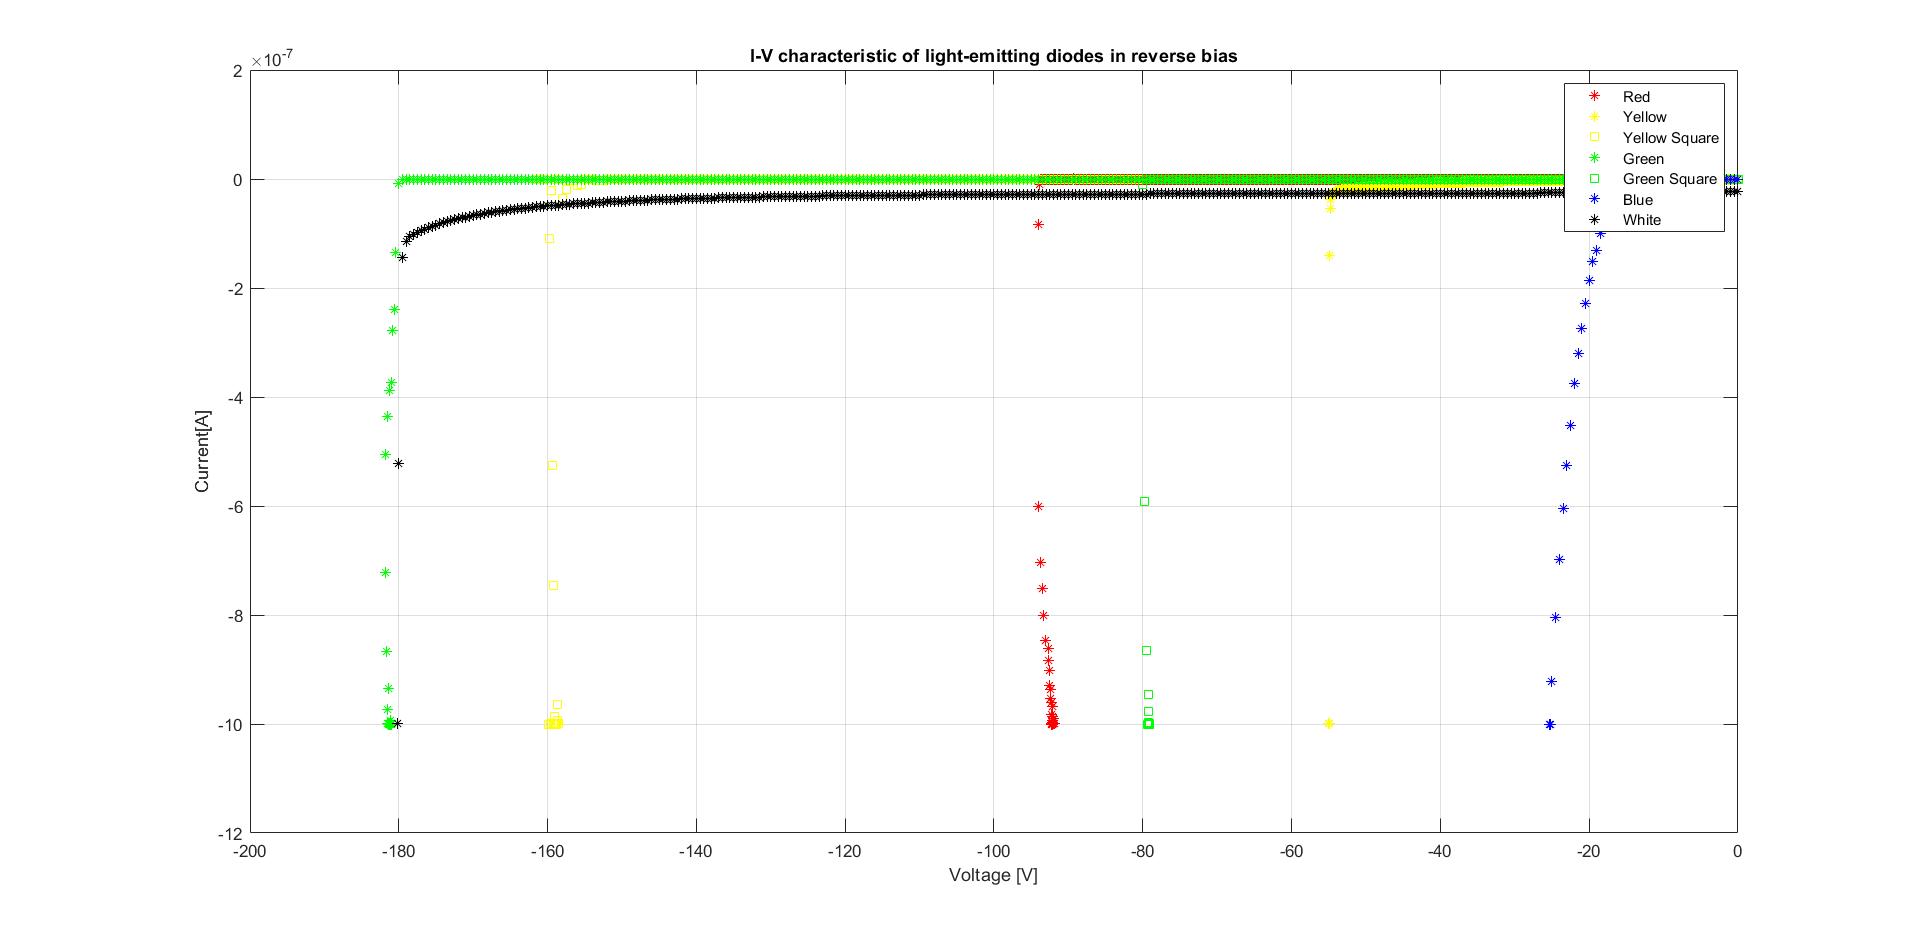
The method to measure breakdown voltage was to sweep increasing voltages in reverse bias and select the voltage corresponding to a avalanche current of a microAmpere. The light emitting diodes were measured in the dark by covering them from lights, as to avoid the photoconductive creation of electron-hole pairs.
Similar colours show great discrepancy between different models or shapes, hinting at either a failure in the experiment setup or a stronger dependence in the doping concentration, or the material used for the diode, as seen in equation 2 the electric permitivity.
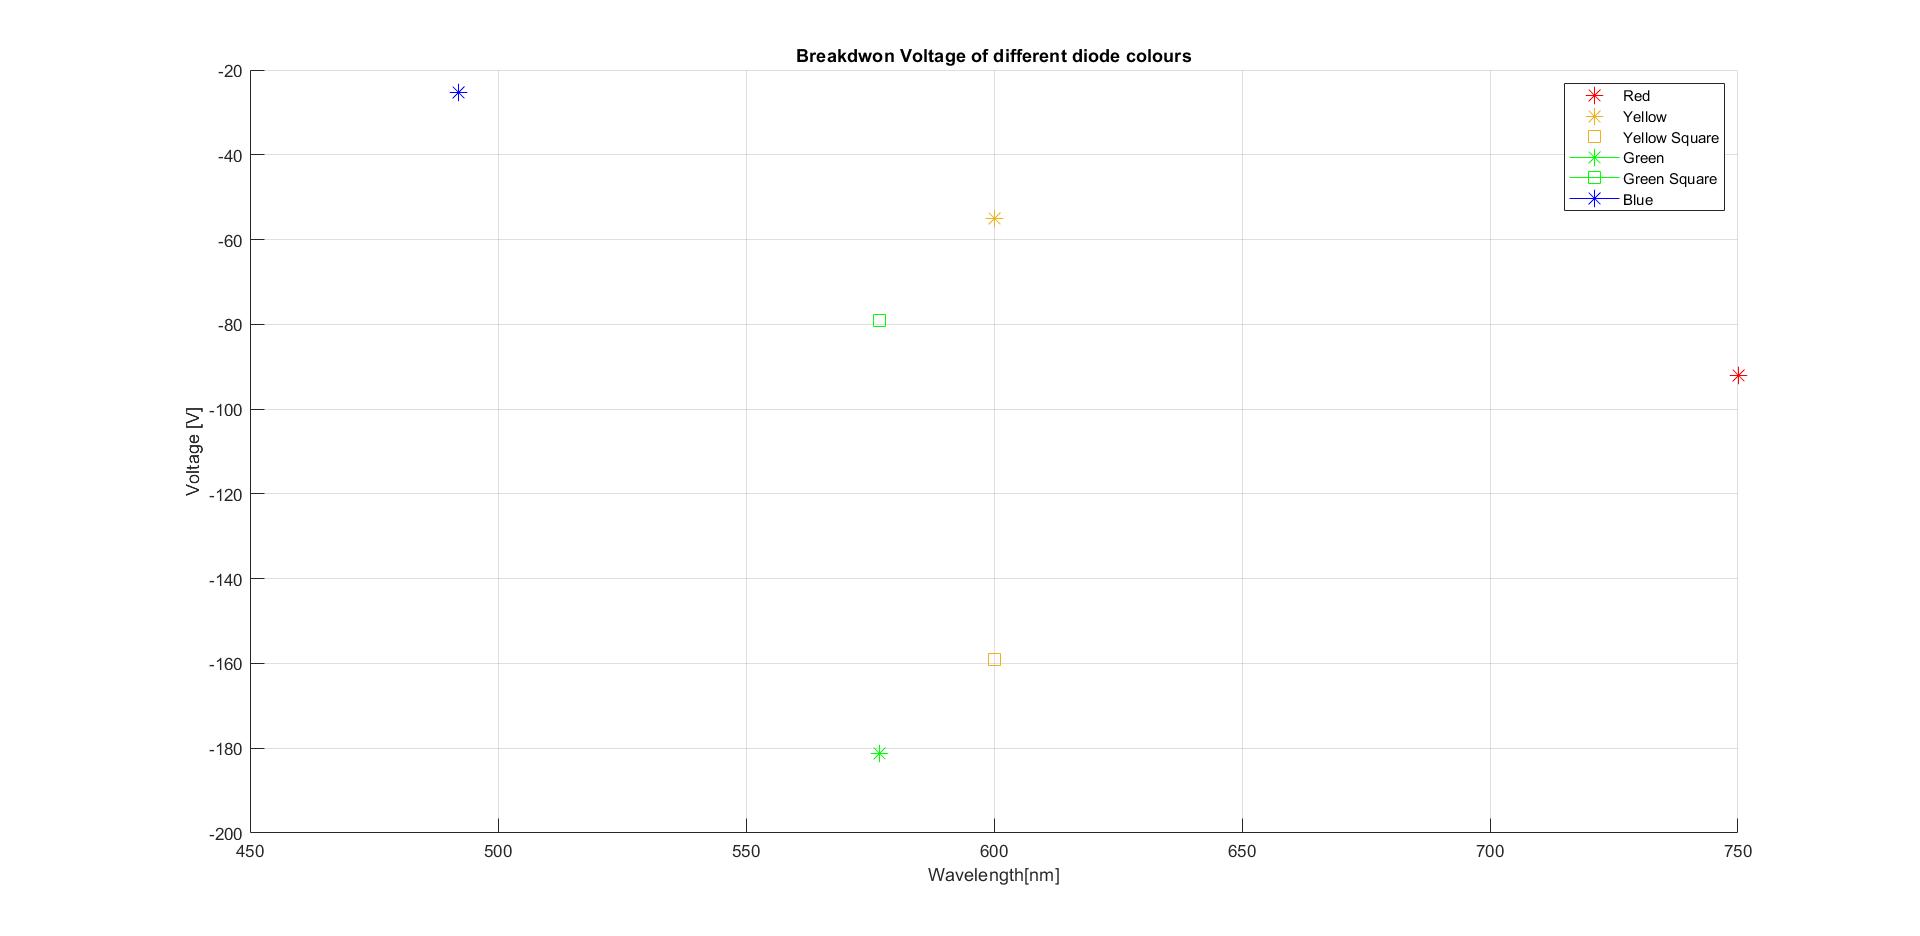
The measurement method does not seem to be determining of the real critical field. The range of breakdown voltages seem to go from 25 to 180, with no particular order. The data that were obtained are not robust enough to be conclusive. More measurements should be made to really understand if there is such a dependence with bandgap of breakdown voltage. The only calculations possible were following equation 1, which are added below. More experiments could compare how accurate this calculations are.
Further experiments that could be made: