A solar panel is an assembly of solar cells that uses light energy from the
sun to produce electricity. A solar cell usually consists of a silicon based
large area pn-junction with a thin and heavily doped n-type layer above a
more lightly doped p-layer. When the cell is exposed to light and a photon
with sufficient energy enters the depletion region through the n-typed layer,
electron-hole pairs are created. Due to the electric field present in the
depletion region electrons will be pushed to the n-side while holes are
pushed to the p-side, forward biasing the diode. By connecting a load with a
smaller impedance than the forward biased diode the generated photo current
can be extracted. In a solar panel, the individual solar cells are connected
electrically in series to achieve the desired voltage and to then in parallel
to increase the current.
The goal of this exercise was to measure the $I/V$ characteristics of a
solar panel for different light levels and temperatures. The measurements
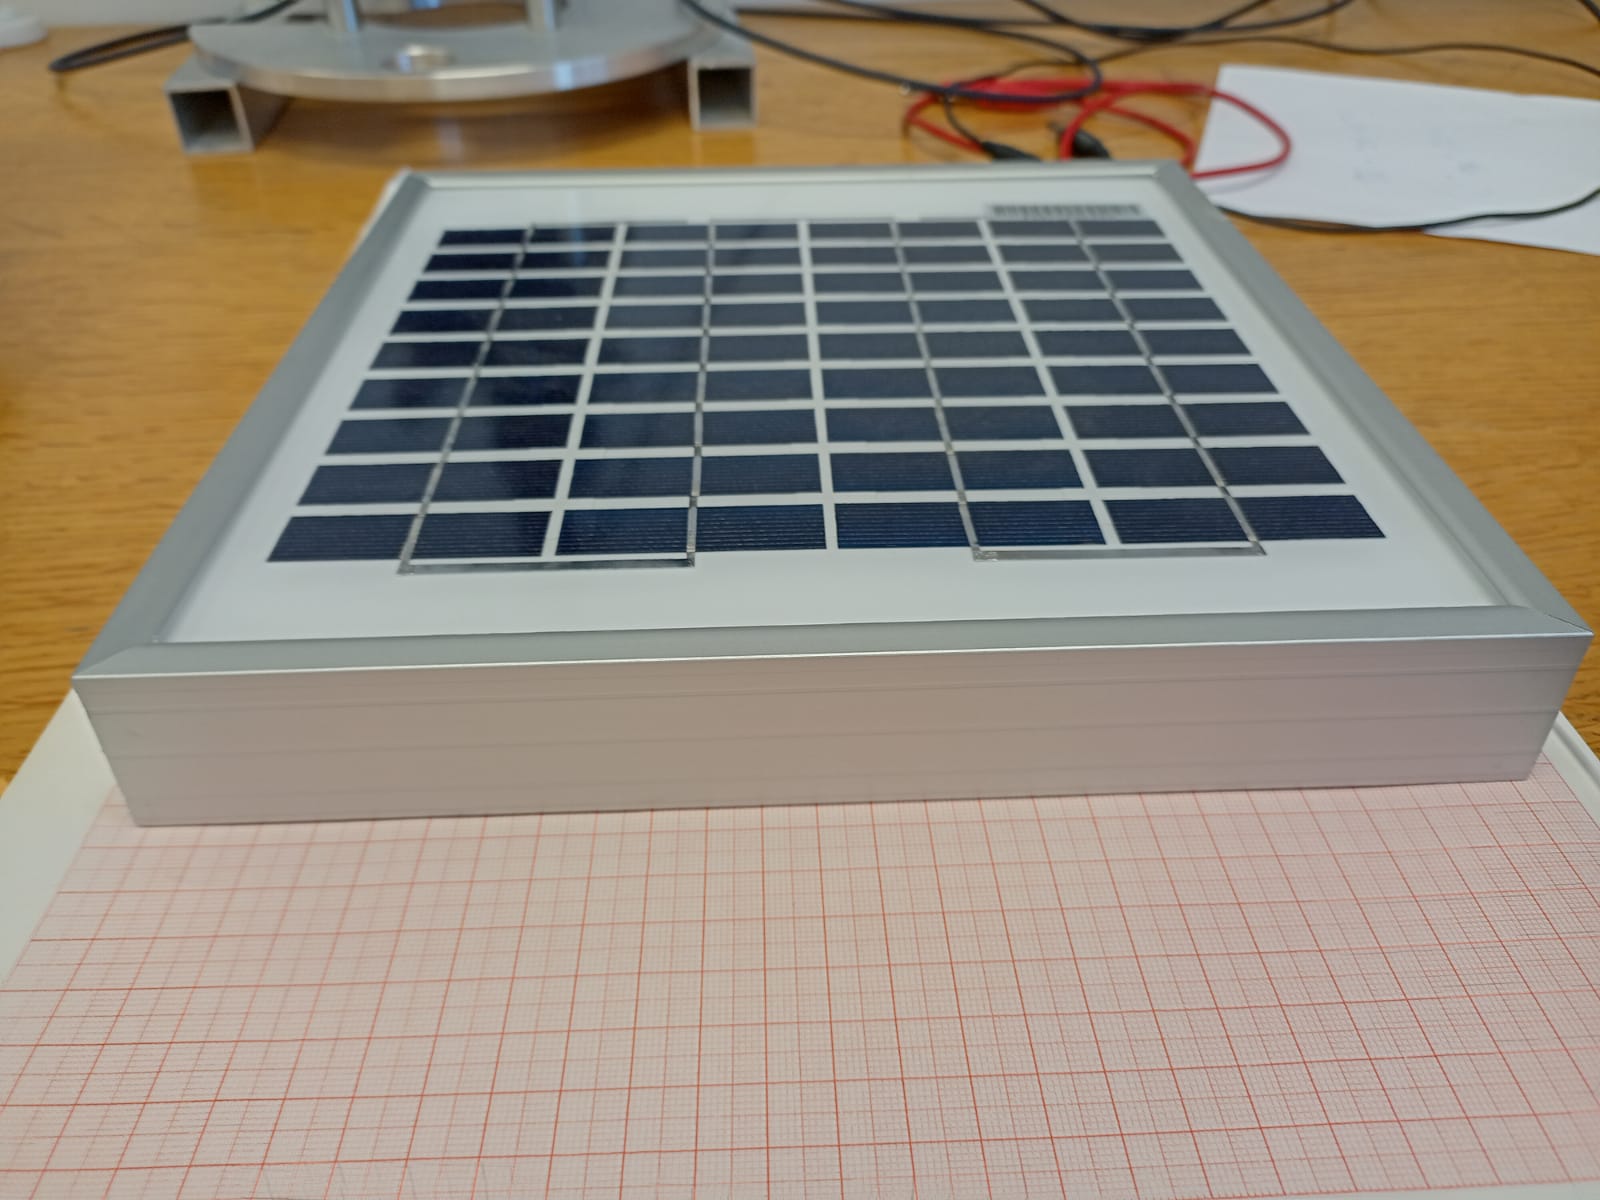
were carried out on a
Phaesun Sun Plus 5 solar module using the
Keithley 2636A System SourceMeter as a voltage supply and current
measurement device. To operate the solar panel in full darkness and to
perform measurements in the temperature range of 10 to 62 °C, a
Vötsch VT4002 climate chamber was used. The following measurements were
performed:
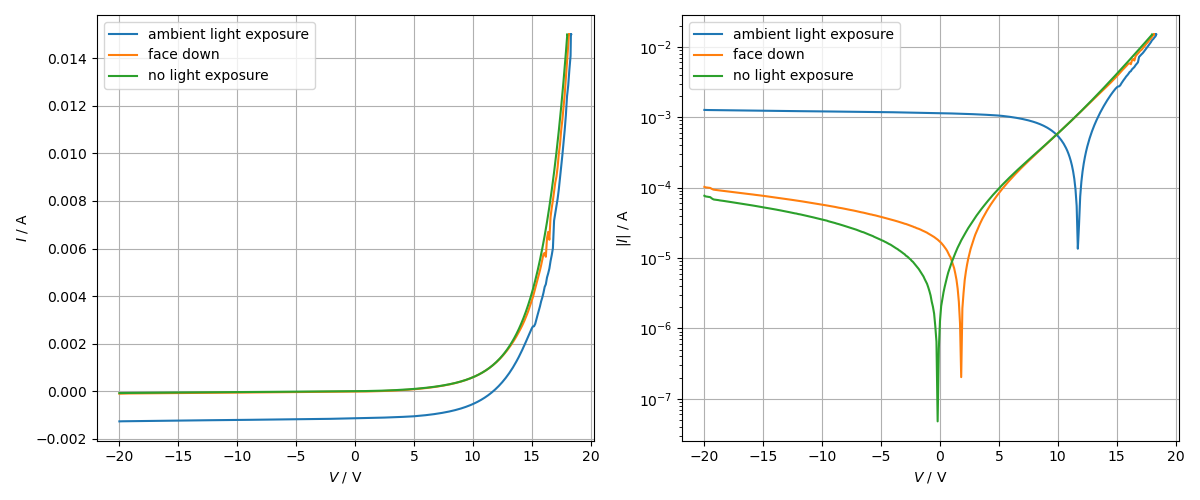
A voltage sweep from -20 to 20 V with the solar panel at ambient light exposure (in the lab near the window on a slightly cloudy day, no direct sunlight exposure), no light exposure (inside the climate chamber) and with its face down was performed at ambient temperature in order to measure the $I/V$ characteristic of the module (see Fig. 2).
The $I/V$ characteristic of an ideal diode at a given Temperature $T$ can be
approximated by the Shockley equation
\begin{equation}
I(V) = I_S \cdot (\exp{(\frac{e \cdot V}{n \cdot k_B \cdot T})}-1)
\stackrel{\frac{e \cdot V}{n \cdot k_B \cdot T} \gg 1}{\approx}
I_S \cdot \exp{(\frac{e \cdot V}{n \cdot k_B \cdot T})}
\end{equation}
where $I_S$ is the reverse bias saturation current and $n$ the ideality
factor. For high enough voltages (about a few hundred mV at room temperature)
the Shockley equation can be approximated with an exponential function and
the saturation current $I_S$ can be calculated via a log-linear fit of the
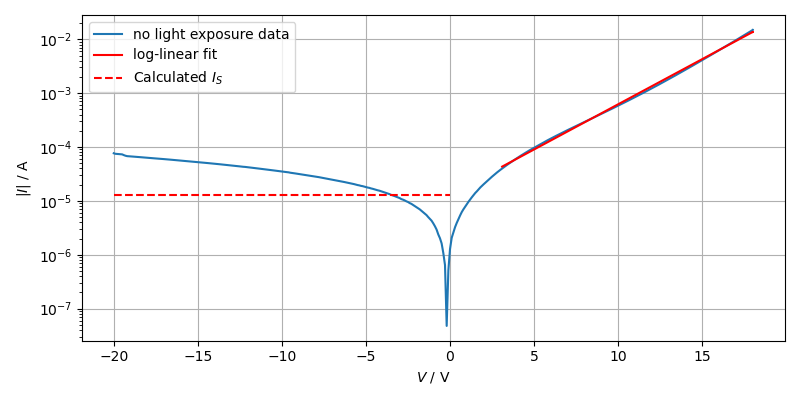
current. Applying this method to the $I/V$ data measured on the solar panel
with no light exposure in the log-linear part between 3 and 18 V
results in the following value:
\begin{equation*}
I_S = (13.1 \pm 0.4) ~ \mu \text{A}
\end{equation*}
Comparing this with the measurement data in reverse bias (see Fig. 3) shows
that the log-linear fit only provides an accurate estimate of $I_S$ at a
voltage of about -4 V. Using a static value as approximation for
the saturation current over a bigger voltage range in reverse bias does
not make much sense as $I_S$ rises linearly with higher applied negative
voltage. The calculated value for $I_S$ deviates by a factor of approximately
$\frac{1}{6}$ from the measured value at a voltage of -20 V.
The characteristics of the solar panel as
stated by the manufacturer at standard test conditions STC
(1000 W/m$^2$ irradiance, 25 °C, 1.5 air mass) are
\begin{align*}
\text{Open-circuit voltage:} &~V_{OC} = 21.0~\text{V} \\
\text{Short-circuit current:} &~I_{SC} = 0.34~\text{A} \\
\text{Peak power:} &~P_{max} = 5~\text{W} \\
\text{Voltage at peak power:} &~V_{max,P} = 16.8~\text{V} \\
\text{Current at peak power:} &~P_{max,P} = 0.30~\text{A} \\
\end{align*}
Assuming that all 36 solar cells in the solar panel are connected in series to increase the
output voltage this leads to per-cell values
\begin{align*}
\text{Open-circuit voltage per cell:} &~V_{OC,pc} = 0.583~\text{V} \\
\text{Peak power per cell:} &~P_{max,pc} = 0.14~\text{W} \\
\text{Voltage at peak power per cell:} &~V_{max,P,pc} = 0.467~\text{V} \\
\end{align*}
which are approximately in line with expected values for commercial solar
cell devices
[1].
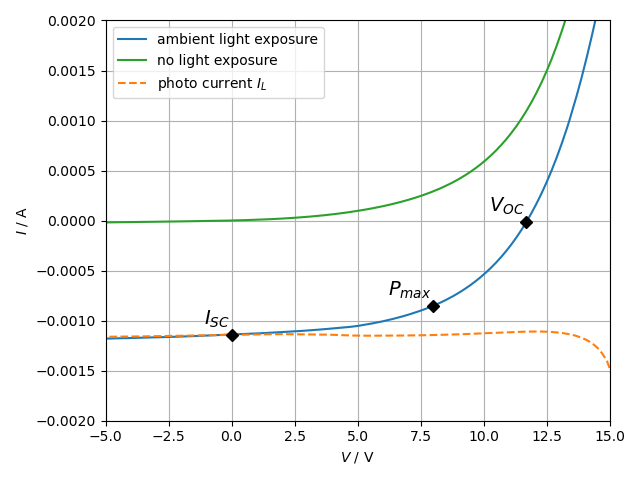
The open-circuit voltage $V_{OC}$ is the maximum voltage that can be
drawn from a solar cell module, and it occurs when the net current through
the device is zero. It can also be thought of as the amount of forward
bias that is generated by the incident light in the depletion region. The
short-circuit current $I_{SC}$ is the current when the solar cell module
is operated at short circuit, $V$ = 0. For a high-quality solar cell with
a low series resistance the short-circuit current is approximately equal
to the light-generated photo current $I_L$. For the examined solar panel
$V_{OC}$ and $I_{SC}$ at ambient light exposure are measured to be (see Fig. 4):
\begin{align*}
V_{OC} &= 11.700~\text{V} \\
I_{SC} &= 1.139~\text{mA}
\end{align*}
It is not possible to extract any power from the solar cell module when
operating at either open-circuit or short-circuit condition. Starting from
0 V, the generated power $P = V \cdot I$ that can be drawn from the solar
panel increases approximately linearly with the applied voltage until it reaches
a maximum and then sharply drops to zero towards the open-circuit voltage.
The maximum power output $P_{max}$ point for the solar panel is calculated
according to Fig. 4:
\begin{align*}
P_{max} &= 6.813~\text{mW at} \\
V_{max,P} &= 8.000~\text{V} \\
I_{max,P} &= 0.852~\text{mA}
\end{align*}
The measured values lie far below the characteristics given by the manufacturer.
This is due to the fact that our measurement has been performed inside the
lab room with indirect sunlight exposure instead of the standard test conditions
used by the manufacturer (comparable to direct light exposure on a sunny
day at an average european latitude
[2]).
A temperature sweep from 10 °C to 62 °C in steps of 4 °C in combination with a voltage sweep from -20 V to 20 V at every temperature step is performed inside the climate chamber (no light exposure). The measured data is shown in Fig. 6 and the measurement code provided below:
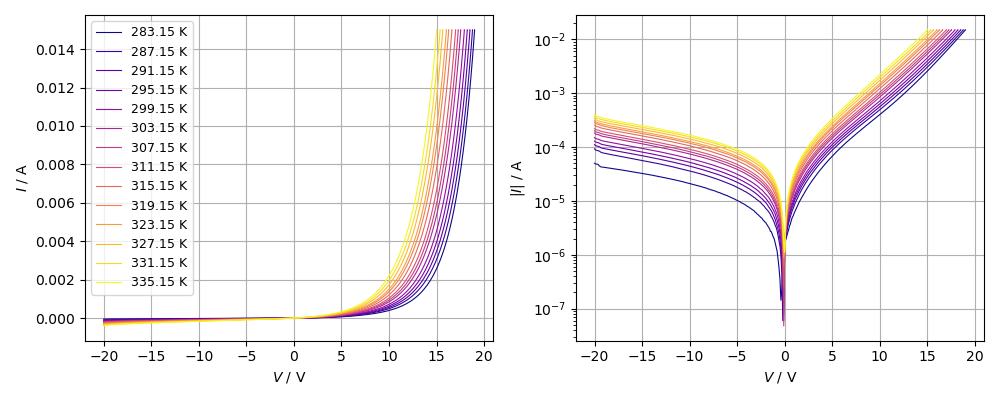
Given the Shockley equation (1) above as an approximation for the diode
$I/V$ characteristic, one may expect the forward current to decrease with
an increase in Temperature at a fixed voltage. However, exactly the
opposite is the case. Reason for this is the temperature
dependence of the reverse saturation current term $I_S$. The
saturation current is a combination of the generation current caused by thermal
generation of electron-hole pairs in the depletion region and the diffusion
current of the minority carriers in the n and p regions diffusing across the
depletion region. Detailed theoretical calculations on the
$I/V$ characteristics
of a pn-diode and the
current-temperature
characteristics of a pn-diode can be found on the Physics of Semiconductor
Devices Website. For a pn-diode the saturation current is proportional to
the squared intrinsic carrier density $n_i$
\begin{equation}
I_S \propto n_i^2
\end{equation}
The intrinsic carrier density has a strong exponential temperature dependence
which allows the saturation current to be approximated as
\begin{equation}
I_S = A \exp \left( -\frac{E_g}{k_B T} \right)
\end{equation}
where $E_g$ is the band gap energy and A is a fit parameter that is to be
determined. Inserting this into the Shockley-equation (1) leads to
\begin{equation}
I = A \exp \left(-\frac{E_g}{k_B T}\right)
\left[ \exp \left( \frac{eV}{k_BT} \right) - 1 \right]
\end{equation}
For sufficiently large voltages $V$ in forward bias the -1 term can be neglected.
By then taking the logarithm and rewriting the equation as a function of $V$
one obtains a linear dependence of $V$ in $T$
\begin{equation}
V = \frac{E_g}{e} + \frac{k_B T}{e} \ln \left( \frac{I}{A} \right)
\end{equation}
In reverse bias the exponential term containing $V$ can be neglected and
only the exponential dependence containing $E_g$ remains. By taking the
logarithm of the absolute value this can be written as a
linear dependence of $I$ over the inverse temperature $T^{-1}$
\begin{equation}
\ln |I| = \ln A - \frac{E_g}{k_B T}
\end{equation}
With equation (5) and (6) we now have a way to calculate the band gap energy
$E_g$ in forward bias at constant current and in reverse bias at constant
voltage for different temperatures via a linear or log-linear fit over $T$ or
$T^{-1}$ respectively.
Fig. 6 shows the measured voltage values taken at the fixed current $I$ = 10 mA
in forward bias over the temperature together with a linear fit. From the first
fit parameter the bang gap energy is calculated via equation (5) to
\begin{align*}
E_g = (40.8 \pm 0.5)~\text{eV}~~~\Rightarrow~~~
(1.132 \pm 0.014)~\text{eV}~~~~\text{(per cell)} \\
\end{align*}
which is in accordance with the typical band gap energy of a single silicon
solar cell.
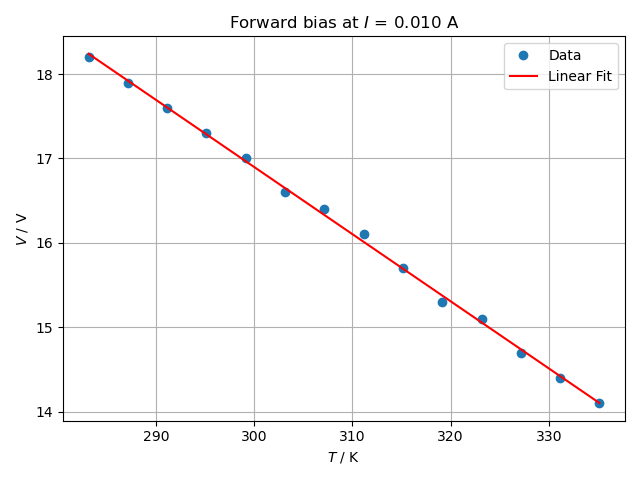
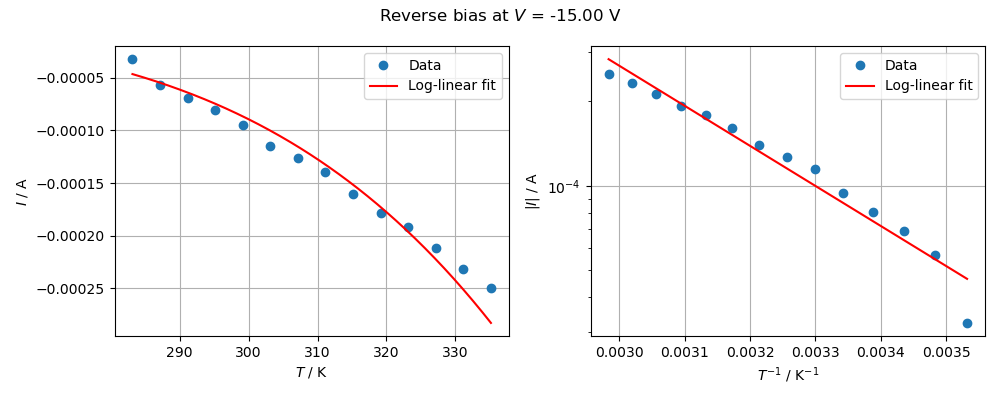
Fig. 7 shows the measured current values taken at a fixed voltage $V$ = -15 V in reverse bias together with a log-linear fit over the inverse temperature. Using equation (6) the band gap energy calculates from the slope of the semilogarithmic line to \begin{align*} E_g = (0.28 \pm 0.04)~\text{eV} \end{align*} This value is far off the expected band gap energy of about 1.12 eV for our silicon solar cells. In Fig. 7 can be seen that the measured data does not match the expected exponentially decreasing behaviour and that a much steeper slope in the semilogarithmic plot would be needed to obtain the expected band gap energy. This suggests that the derivations above for the saturation current $I_S$ do not hold for the measured temperature range and that other (probably thermal) effects influence the saturation current. Additional considerations in the theoretical derivation or measurements (on single solar cells) need to be taken into account to correctly describe the temperature dependence of the saturation current in reverse bias.