Introduction
Power diodes are fundamental components in electronic circuits, renowned for their capability to handle high
currents and voltages. The performance and efficiency of these diodes are significantly influenced by temperature,
which affects their I-V (current-voltage) characteristics. Understanding the temperature dependence of these characteristics
is crucial for designing robust and reliable electronic systems.
This lab aims to measure the temperature-dependent I-V characteristics of a power diode.
Discrepancies often arise between the calculated and measured I-V curves. By analyzing the measured curves in a semilogarithmic
diagram (semilogy), the non-ideality factor (n) can be determined in two distinct regions of the measured curve, which deviate
from the theoretical predictions. These regions correspond to the recombination and diffusion components of the current.
Accurately identifying and understanding these regions are essential for improving the accuracy of diode models and enhancing
the design of electronic systems.
Determining the non-ideality factor n
The shape of of an I-V curve of a diode can be describe by the Shockley diode equation. It is named after transistor co-inventor William Shockley and it models the exponential current-voltage (I-V) relationship in moderate constant current forward bias or reverse bias. For more information on the Shockley equation, see Shockley diode equation/wiki. The Shockley equation is given by:
$$I = I_{S} ( e^{\frac{V}{nV_T}} - 1 ) $$
- I: The diode current.
- IS: The reverse saturation current.
- V: The voltage across the diode.
- n: The ideality factor, a number between 1 and 2 that typically accounts for the deviation from the ideal p-n junction behavior.
- VT: The thermal voltage, given by \( V_T = \frac{kT}{q} \), where:
- k: Boltzmann's constant (\(1.38 \times 10^{-23} \, \text{J/K}\)).
- T: Absolute temperature in Kelvin.
- q: Charge of an electron (\(1.602 \times 10^{-19} \, \text{C}\)).
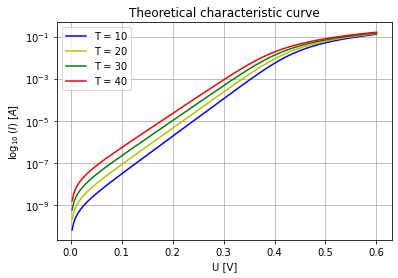
The following plot shows the theoretically predicted IV curve of a diode according to the Shockley equation. The graph is taken from PN diode IV characteristics.
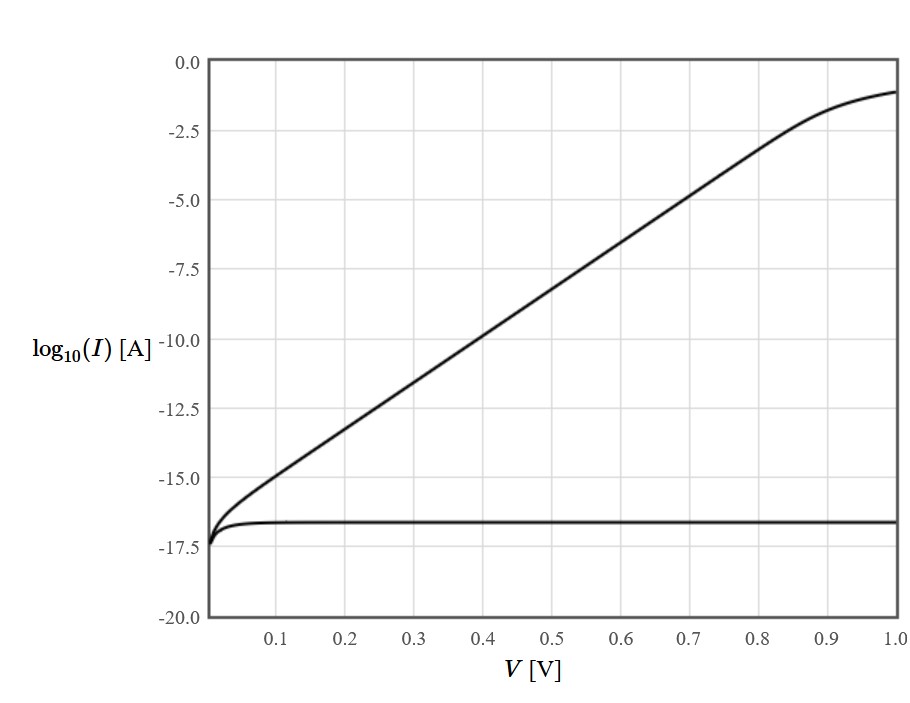
The IV curve graph displays the voltage (V) on the x-axis and the logarithm of the current (log_10(I)) on the y-axis. The upper line represents the forward bias region of the diode, showing an linear (exponential in cartesian coordinates) increase in current with increasing voltage. The lower line represents the reverse saturation current, which remains nearly constant and very low when the diode is reverse-biased.
In the experiment, the I-V curve is measured for different temperatures between 10 and 40 °C. This is done by connecting the power diode in forward bias to channel A of the Keithley 2600 Series Sourcemeter, applying a voltage between 0
and 0.6 volts, and measuring the resulting current. The setup is then placed in the climate chamber for proper temperature control. This experimental setup is controlled by the Python code shown in the text area at the end of this section.
The non-ideality factor n is determined in the lower voltage range from 0.02 V to 0.08 V and for 0.2 V to 0.4 V. This is done by fitting the curve with an exponential fit in the respective regions. The python code for calculating the fit can be seen
in the second text area in the Appendix. The following two plots show the results of the two fits and the measured data.
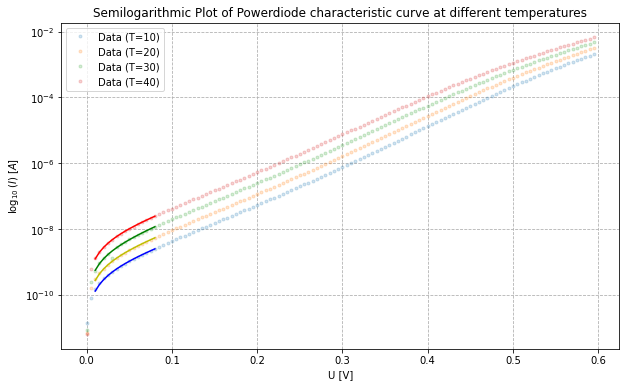
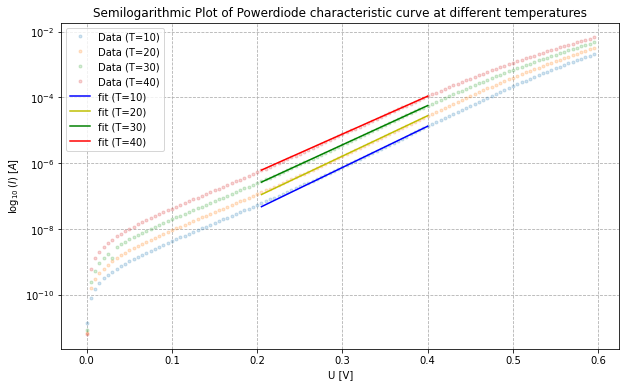
It can be seen that in the lower region the fit does not give a linear slope. This can be explained by the dominance of the -1 term in the Shockley equation. Theoretically, the recombination mechanism contributes more to the current in this region resulting in a theoretical non-ideality factor of 2. The second region refers to the diffusion mechanism, which should be dominant at higher voltages since it is the main mechanism of current through a diode. Theoretically the non-ideality factor in this region should be 1. The following table shows the non-ideality factors of the two fits. As we can see the results of the fit in the recombination region $n_l$ corelate for low temperature but deviate more and more for increasing temperatures. On the other hand the values for the diffusion region $n_h$ stay almost stable with increasing temperature but deviate from the prediction.
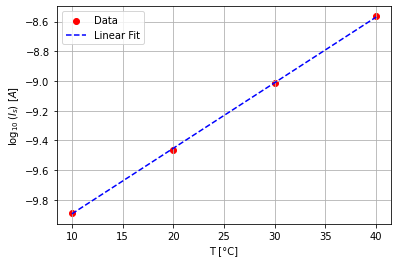
The reverse saturation current $I_s$ also can be determined by using the exponential fit. The values for the reverse saturation current can be used to show the dependancy of the $I_s$ to the temperature T. The following plot shows, that there is an exponential connection between those values. This makes sense since the reverse saturation current is dependent on the intrinsic carrier concentration $n_i$ which itself is an exponential function of the temperature. The values for the (See PN diode IV characteristics)
Fitting the characteristic curve with a modified Shockley Equation
To get an accurate fit of the whole curve a modification of the Shockley equation is used. For this two terms of the original equation are added up with two independent saturation currents $I_s$. The double exponential Shockley equation is given by:
$$ I = I_{s1} \left( e^{\frac{V}{n_1 V_T}} - 1 \right) + I_{s2} \left( e^{\frac{V}{n_2 V_T}} - 1 \right) $$
where:
- \( I \) is the diode current
- \( I_s \) is the reverse saturation current
- \( V \) is the voltage across the diode
- \( n_1 \) and \( n_2 \) are non-ideality factors
- \( V_T \) is the thermal voltage
The theoretical plot is calculated using the program from PN diode IV characteristics and than ploting the resulting data with a python program. Since there is no knowledge about the measured Power diode, certain parameters have to be guessed. To get the best matching result we use the Germanium preset for the calculation. In the following plot we can see that there is a strong similarity. It has to be noticed though, that the theoretical curve has a hihger slope.
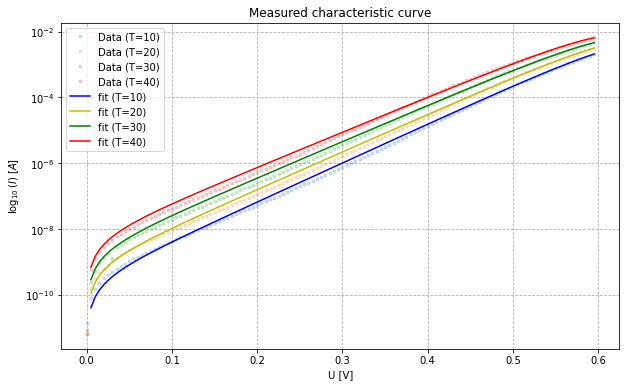
The following table shows the fit parameters of the modified double exponential Shockley equation. Using these parameters in combination with the Python code for the double exponential fit in the first text area of the Appendix, we obtain the plot of Figure 5.
In the text area below is the Python code used to generate the data for the temperature dependent IV curves. The Keithley 2600 Python library is used to communicate with the sourcemeter, the voetsch.py is used to communicate with the climate chamber and the eLabFTW_config_api2_semilab library is used to upload the acquired data directly to the ELAB page. These libraries have to be in the same directory as the used Python code. Below the text area the python code and the measured datas are linked.
Appendix
The following python code is used to fit the double exponential Shockley equation. The files variable path must be adapted to the location where the created data or the downloaded data from this page are stored. Ensure that only usable data files are in the specified folder, as the code will read all files within that directory.
The following python code is used to execute an exponential fit for the region of interest. The files variable path must be adapted to the location where the created data or the downloaded data from this page are stored. Ensure that only usable data files are in the specified folder, as the code will read all files within that directory.