
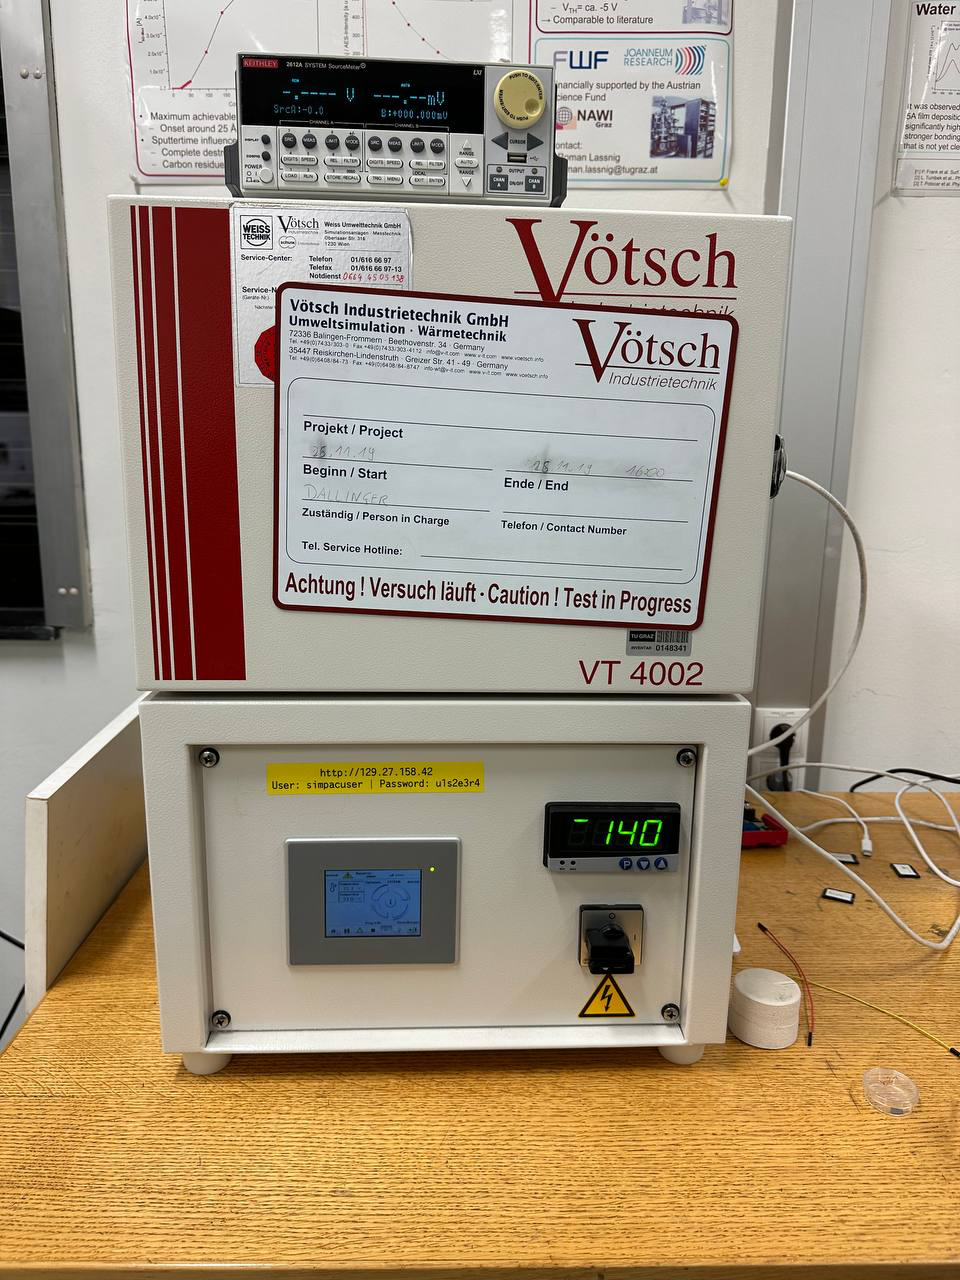
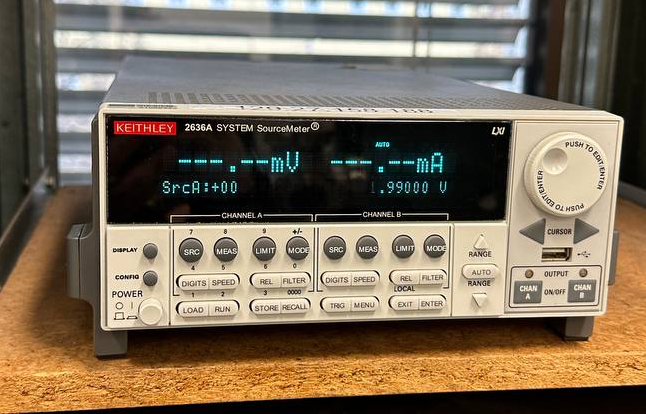
Fig.1 Measurement Setup, from left to right: diode on breadboard; Vötsch VT4002 climate chamber; sourcemeter
2. Aims of the measurements
The aim of the measurement was to determine the currents that were running through the red diode for applied voltages as a function of temperature. For this purpose, the climate chamber set temperatures between $10\,°C$ and $40\,°C$ and for every temperature the source meter swept through voltages from $-2\,V$ to $2\,V$ and the current was measured.
The following script was used to sweep the temperature inside the climate chamber and get the corresponding
I-V-curves: temperaturesweep_IV_curves_diode.py:
3. Data analysis and results
The goal was to examine the temperature dependence of saturation current Is and non-ideality factor η. Following code was used to analyse the measured data and to generate figures 2 to 4: saturation_current_non-ideality_factor.py:
The I-V-curve, visible in figure 2, was obtained in three seperate measurements. The first one, ranging from $-2\,V$ to $0\,V$ was measuered with a low current limit at $(1e-8)\,A$. The second measurement was then taken from $0$ to $2\,V$, where the current limit was set higher at $(1e-5)\,A$, at about $1.5\,V$ the current limit was reached. The missing data was taken from a 3rd measurement with a high current limit $(3e-2)\,A$ up to $2\,V$. In figure 2 the I-V-curve at $22\,°C$ is visible, the current is plotted on a log scale, a log scale is used as it makes eponential growth easier to see. The reverse bias has no clear downwards trend which results from a lack of sensitivity of the sourcemeter and the data got lost in the noise. In forward bias the cut-in voltage is around $1\,V$. At around $1.5V$ the serial resistance regime is reached which results in a bend of the I-V-curve. The jump at $0\,V$ voltage comes from the different measuring ranges for reverse and forward bias. In figure 3 the temperature dependence of the I-V-curve of the red diode are visible. It is clear to see with increasing temperature the current increases which is an expecting behavior.
 Fig.2 I-V-curve of the red diode for $22\,°C$
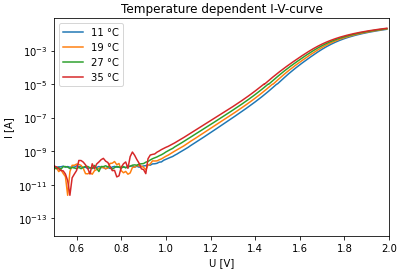 Fig.3 Temperature dependence of the I-V-curve of the red diode
To determine the saturation current $I$$s$ and the non-ideality factor $η$ the Shockley diode equation was used:
$$ I = I_S\left(\exp\left(\frac{eV}{\eta(V) k_B T}\right) - 1\right)$$The equation is only valid for a diffusion dominant model which means it can not be used in reverse bias. The non-ideality factor is used to describe forward bias and has to do with recombination in the depletion zone. Here $I$ is the current, $I$$s$ the saturation current, $V$ the applied voltage, $T$ the temperature, $e$ the electron charge, $k$$B$ the Boltzmann constant and $η(V)$ the non-ideality factor which is voltage dependent.
It is important to note the equation is only valid during exponential growth of the diode's I-V-curve which, when plotted on a logarithhmic scale, is linear, see figure 3. As mentioned before the bend-over area after the exponential growth of a I-V-curve of a diode results from the serial resistance of the p-n junction. Voltages in forward bias increase the exponential term of the equation which makes the -1 part of the equation neglectable. To calculate $η$ the fraction of two currents on the I-V-curve ($I$$2$ divided by $I$$1$) has to be performed in an iteration process. Applying the natural logarithmus and rearranging the equation leads to:
$$ \ln\left(\frac{I_2}{I_1}\right) = \frac{e}{k_B T} \left(\frac{V_2}{\eta(V_2)} - \frac{V_1}{\eta(V_1)}\right). $$$I_1$ is the current in the diode for an applied voltage $V_1$ and equivalently for $I_2$. Under the assumption that $η$ stayed constant for small voltage differences $\Delta V$ the non-ideality factor is
$$ \eta = \frac{e}{k_B T} \frac{V_2-V_1}{\ln (I_2)-\ln (I_1)}. $$In figure 3 the temperature dependence of $η$ can be found, it is important to note that $η$ is only valid for exponential growth which is from $1\,V$ until about $1.5\,V$ (dependend on the temperature), after this the curve starts to bend because of the serial resistance of the p-n junction and the values are not reasonable anymore. It can be noticed in the valid range of $η$ that $η$ gets lower with higher temperature.
 Fig.3 Temperature dependence of the non-ideality factor $η$ from the red diode
With $η$ known the next step is to calculate $I$$s$ as a function of temperature:
$$ I_S = \exp \left( \ln I - \frac{eV}{\eta(V) k_B T}\right). $$In figure 4 the temperature dependence of the saturation current can be seen, it has to be noted that $I$$s$ is dependend of voltage as well. The curve has a very similar form as the non-ideality factor in figure 3, which means the saturation current is strongly depended on the non-ideality factor which is inversely dependend on temperature. It is important to note that similar to $η$ only the exponential growth regime of the diode is valid for $I$$s$ and therefore only voltages from about $1\,V$ to about $1.5\,V$ (dependend on the temperature) give valid $I$$s$ values. It can be noticed that $I$$s$ rises with temperature which is an expected behavior.
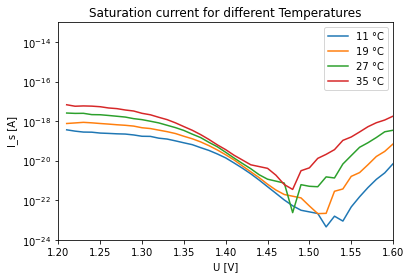 Fig.4 Temperature dependence of the saturation current $I$$s$ of the red diode
As there was no data sheet for the red diode, the calculated $I$$s$ values have been compared with diodes made out of different semiconductors at $11\,°C$, $19\,°C$, $27\,°C$ and $35\,°C$. The $I$$s$ values taken for diodes made out of different semiconductors were calculated without a non-ideality factor which means $I$$s$ does not change with different voltage. This is not the case fot the red diode, for this reason the calculated value of $I$$s$ was chosen at $1.25\,V$ as $I$$s$ was mostly constant in that range. The values for $I$$s$ of different diodes made out of different semiconductors and the red diode chosen in this laboratory can be seen in the following table, it is noteworthy that the rate of change of $I$$s$ with temperature is different for every diode made of different semiconductor as well as the red diode used in this laboratory which means no conclusive assumption about the semiconductor used in the red diode can be made.
| $I$$s$ $[A]$: Si | $I$$s$ $[A]$: Ge | $I$$s$ $[A]$: GaAs | $I$$s$ $[A]$ at $1.25\,V$: Red Diode | |
|---|---|---|---|---|
| 11°C | 2.7e-16 | 1.3e-8 | 3.1e-23 | 2.5e-19 |
| 19 °C | 1.1e-15 | 3.3e-8 | 2e-22 | 7.6e-18 |
| 27 °C | 4.5e-15 | 8.3e-8 | 1.1e-21 | 2.1e-18 |
| 35 °C | 1.6e-14 | 2e-7 | 5.9e-21 | 5.4e-18 |
| $\frac{I_{s\_35°C}}{I_{s\_11°C}}$ | 60 | 15 | 190 | 22 |