In this part of the laboratory exercise the goal is to measure the I-V curve of an IR-LED and of a Photo-Diode. To measure the I/V curve a sourcemeter unit (SMU) Keithley 2600 Series Sourcemeter is used and controlled with a script in Python which is given below in its general form.
The semilogarithmic I-V-curves of the LED show exponential behavior as expected, because the negative current can't be plotted in logarithmic scale the current in the reverse bias region is plotted as the absolute value. The alternation of positive and negative voltage occurs as a kink in the plot. It is interesting that the link does not appear at 0V as expected, but is shifted slightly to 0.6 V. It is important to note that for high voltages the I-V-curve becomes linear on forward bias. This can be explained by the fact that the linear series resistance of the diode is measured for high voltages and its component can be neglected for smaller voltages.
The non-ideality factor and the saturation current can now be calculated from the Shockley equation by slightly modifying this formula:
\begin{equation} I(V) = I_S \cdot (\exp{(\frac{e \cdot V}{n \cdot k_B \cdot T})}-1) \end{equation}For high currents ($V > 0.5V$) , the -1 term can be neglected and the Tempereature $T= 20°C$ is assumed. This leads to the equation for the forward bias:
\begin{equation} I(V) = I_S \cdot (\exp{(\frac{e \cdot V}{n \cdot k_B \cdot T})}) \end{equation}The light current generated by the photons $I_L$ hitting the p-n junction is observed at $I(V=0)$ and then subtracted from all the whole I-V-curve. The data of diode in the forward bias is fitted with the Schockly equation and the saturation current $I_S$ and non-linearity factor $n$ are calculated.
\begin{equation} I_L = -4.46283\cdot 10^{-09}~\mathrm{A}\\ I_S = 2.502 \cdot 10^{-14}~\mathrm{A}\\ n = 1.944 \end{equation}Using the Shockley equation in reverse bias leads to imprecise results and we used a more precise model for the reverse bias which considers the change in the width of the depletion zone and the current from charge carrier generation in the depletion zone. As the model for the depletion zone we use the abrupt junction model. We got this model from [1]
We assume $V < -0.1V$ that leads to:
\begin{equation} I(V) = -I_S + \sqrt{(b\cdot (a-V))} \end{equation}Then subtract $I_S$:
\begin{equation} I = \sqrt{(b\cdot(a-V))} \end{equation}Then the square of the equation is taken and a linear fit leads to the results:
\begin{equation} a = -0.798 ~\mathrm{V}\\ b = 3.036\cdot 10^{-19}~\mathrm{A}\\ \end{equation}As one can clearly see in Fig. 2 the more precise model leads to a very good fit which can explain the raise of current for a larger reverse bias.
The following data was measured for the forward bias:
The photodiode consists of an active p-n junction which is operated in reverse bias. When light falls on the junction, a reverse current flows which is proportional to the illuminance. This response is linear.
As before with the LED, the saturation current, the light generated current and the ideality factor in the forward bis are calculated using the modificated Shockley equation (4) .
\begin{equation} I_L = 8.478\cdot 10^{-09}~\mathrm{A}\\ I_S = 1.990\cdot 10^{-07}~\mathrm{A}\\ n = 1.085 \end{equation}For this part of the experiment we measured the I-V-curve of the Photo-Diode in a dark climate chamber without light from the environment. We then used different currents to illuminate the IR-LED which was right next to the Photo-Diode and measured the I-V-curve for different currents.
You can download the raw data here.
Afterwards we fitted all of the I-V-curves with the simple Shockley equation and neglected the more complex behavior for the reverse bias. This gives us the non-ideality factor and the saturation current for different levels of illumination. The resulting plots with the fitted curves are depicted in the following figure.
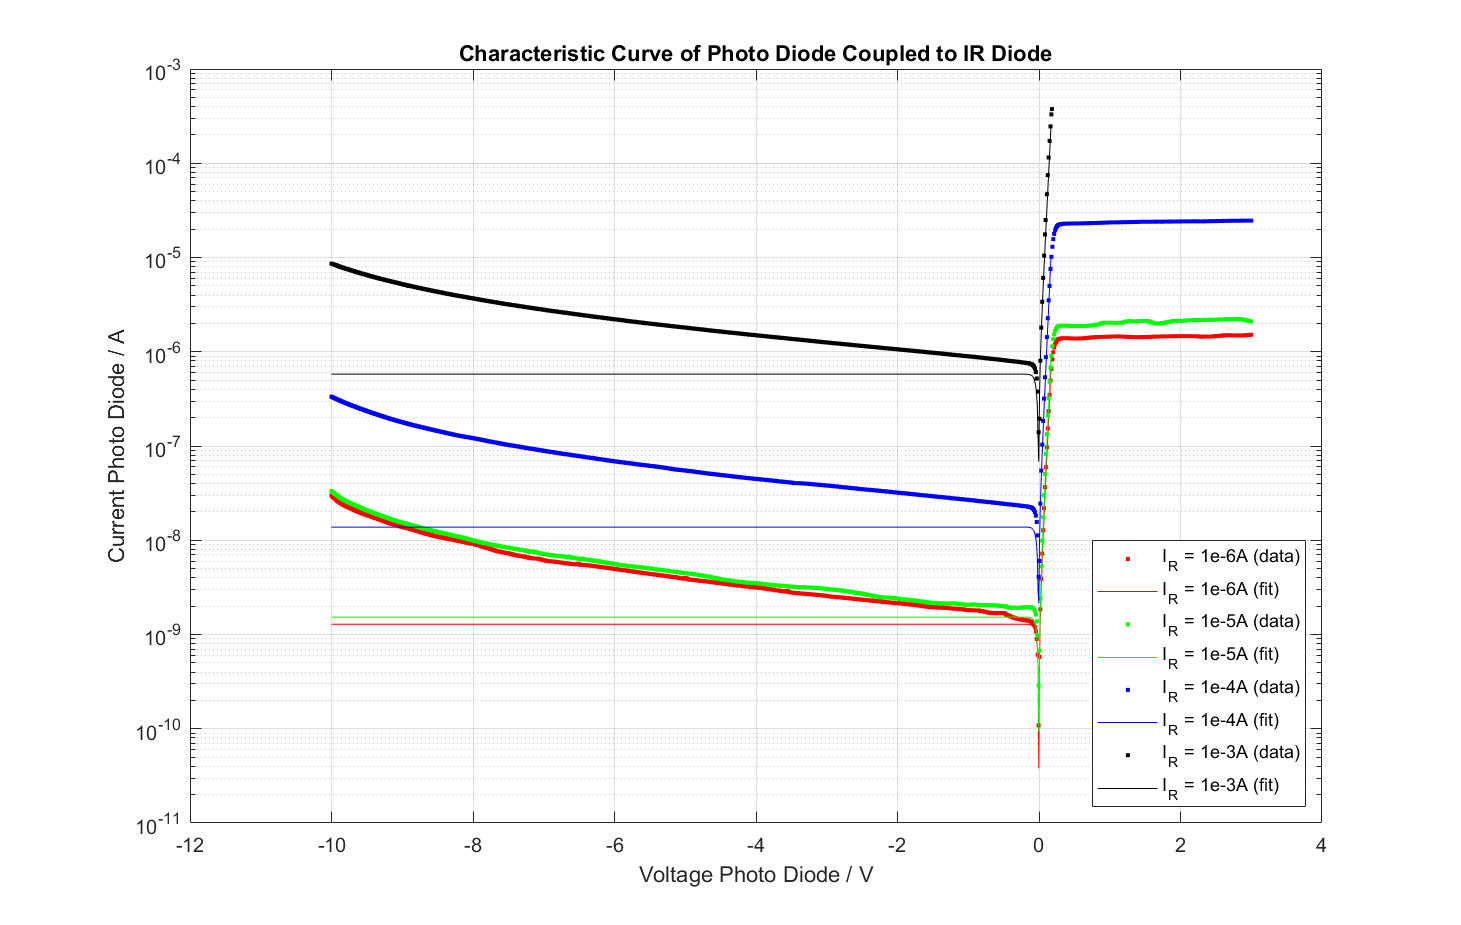
The results for the light generated current, saturation current and non-ideality factor from the fit witht he Shockley equation are listed in the following table.
| Current in IR-LED ILED \ A | Light generated current IL \ A | Saturation Current IS \ A | Non ideality factor n \ 1 |
|---|---|---|---|
| 1e-6 | 1.10e-10 | 1.39e-9 | 1.09 |
| 1e-5 | 2.87e-10 | 1.82e-9 | 1.08 |
| 1e-4 | 4.09e-9 | 1.79e-8 | 1.06 |
| 1e-3 | 1.4e-7 | 7.19e-7 | 1.15 |
The first observation is that we can use the Photo-Diode in forward-bias very well to differentiate the brightness of the IR-LED. Also we see that the parameters in Schockley equation change with the level of illumination. More specific we see that the saturation current increases a lot with the level of brightness and also the light generated current has the same behavior. On the other hand the non-ideality factor remains close to constant.
Now we set the current in the IR LED constant to 0 or to 1e-8 A and did an I-V-curve measurement in the climate chamber for temperatures from 15°C until 60°C in 5°C steps. After the measurement the I-V-curve for the bright case was fitted with the Schockley equation in the area of forward bias. The measured data and the fitted curves are depicted in the following figure.
You can download the raw data here, here and here.
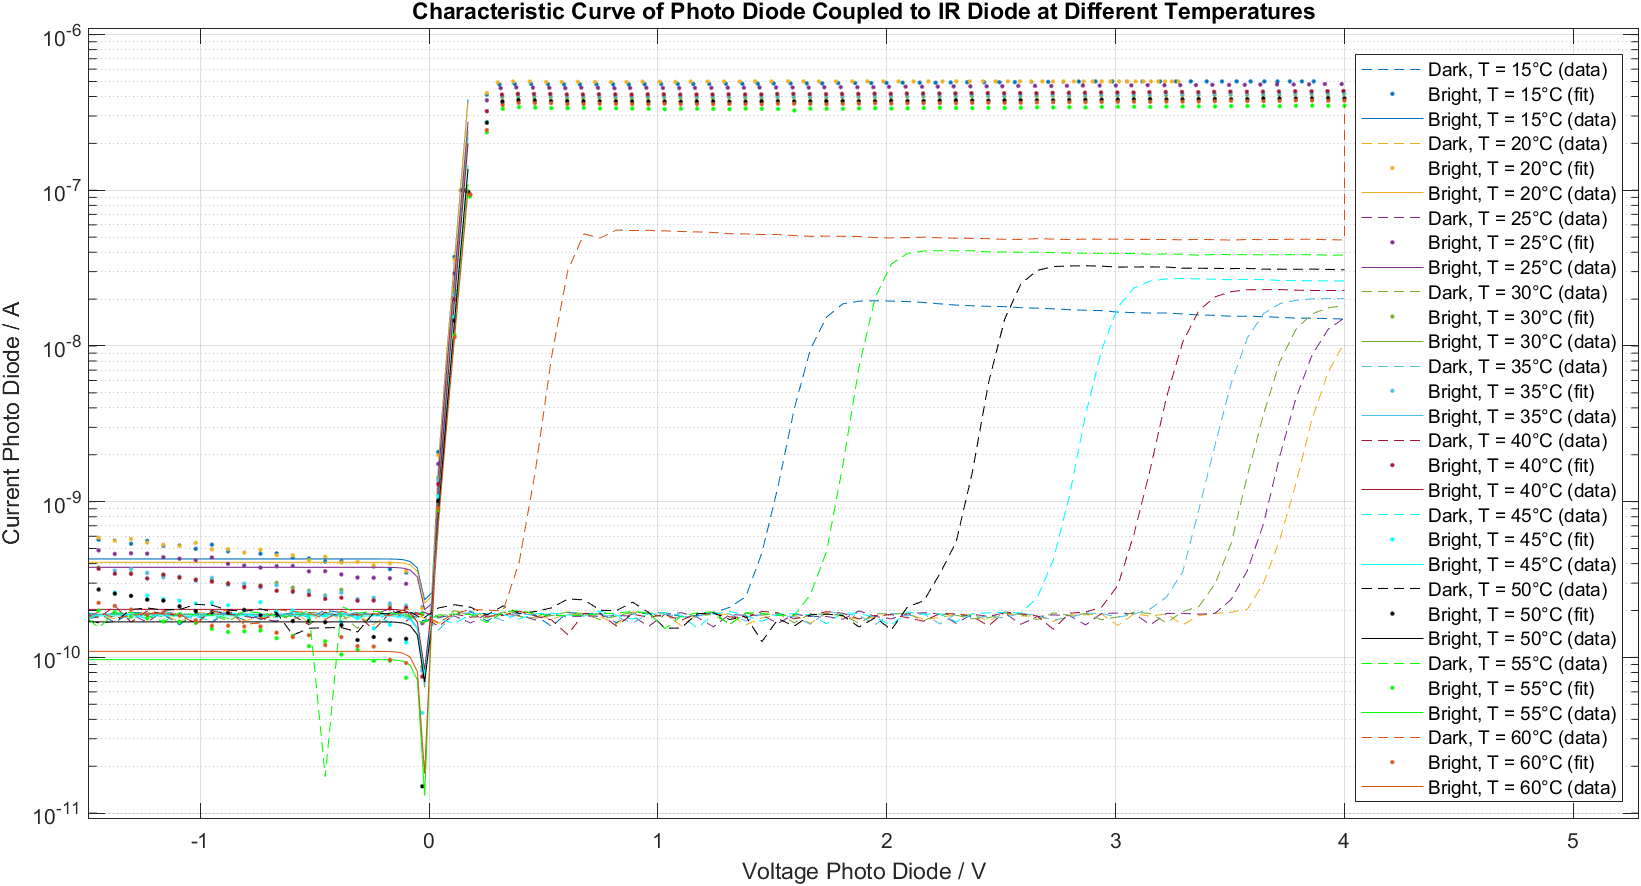
An interesting observation is that in the bright case the Photo-Diode behaves very similar for different temperatures whereas in the dark case the behavior depends strongly on the temperature. Also in the dark case the curves are shifted a lot along the x-axis.
[1]: Physics of Semiconductor Devices, Third Edition, S.M. Sze and Kwok K. Ng