The temperature dependence of the current voltage characteristics of a Schottky diode was investigated using a sourcemeter (Keithley 2600 Series) operating in four point mode.
For this purpose the Schottky diode was put in a climate chamber (Vötsch VT4002) where its IV curve was then recorded for temperatures ranging from 10°C to 50°C.
The python script that was used to control the instruments was given as a template and was adapted as needed for the measurements (see box below).
All the recorded data was saved using 'eLabFTW'.
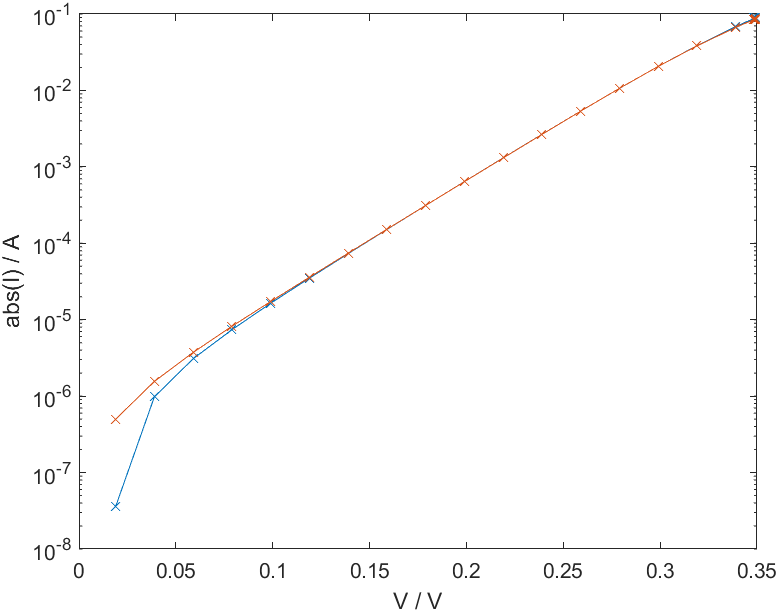
The figure below displays the IV-curve, for different temperatures and positive bias voltages, on a semilogarithmic scale.
Since attempts of fitting the experimental data in order to retrieve values for the saturation current $I_0$, the series resistance $R_S$ and the ideality factor $\eta$ did not work well, a different approach was chosen.
This approach is formulated in 'Calculating the parameters of a Schottky diode using forward bias, I-V data: an alternative approach' by Haziret Durmus and Ülfet Atav.
We start with the equation for the current voltage characteristics of a diode, as given in the material of the lecture 'Physics of Semiconductor Devices':
This expression can be simplified in the case of sufficiently high forward bias voltages:
$$I = I_S\left(\exp\left(\frac{e(V-IR_S)}{\eta k_BT}\right)\right)\hspace{0.5cm}\text{[A]}$$Introducing the 'power exponent' $\alpha(V) = \frac{dln(I)}{dln(V)}$ and performing an integration
$$\int \frac{\alpha(V)}{V} dV = \int d(\frac{e(V-IR_S)}{\eta k_BT}) = \int dln(I)$$ $$\Lambda(V) = \frac{e(V-IR_S)}{\eta k_BT} = ln(I) + \Lambda_0$$allows us to obtain the argument of the exponential term $[e(V-IR_S)/(\eta k_BT)]$ within an integration constant $\Lambda_0$.
Differentiating the equation for the current with respect to the bias voltage gives us:
which is reduced to
$$(\frac{e\eta}{k_BT} + IR_S) = \frac{V}{\alpha}$$if we ignore the voltage dependence of the parameters.
We can now define the ideality factor $\eta$ and the series resistance $R_S$ in terms of the power exponent $\alpha$ and the variable $\Lambda$ that we introduced before:
In order to determine the integration constant $\Lambda_0$ the power exponent $\alpha$ is plotted as a function of the bias voltage V.
Since the power exponent increases in the low bias voltage region and starts to decrease again for higher voltages, one can then determine the maximum of the power exponent $\alpha_{max}$ in this graph.
At this position the equation for the integration constant becomes
where $V_{max}$ is the voltage where the power exponent reaches its maximum.
The saturation current can than be calculated as
This way the following parameters were calculated for our experimental data:
| T / °C | $I_0$ / A | $\eta$ | $R_S$ / $\Omega$ |
|---|---|---|---|
| 10 | 1.1523e-07 | 1.1498 | 0.0686 |
| 15 | 7.3082e-08 | 1.0691 | 0.1059 |
| 20 | 1.5126e-07 | 1.0917 | 0.0903 |
| 25 | 1.4672e-07 | 1.0437 | 0.1406 |
| 30 | 2.7560e-07 | 1.0614 | 0.1199 |
| 35 | 5.3176e-07 | 1.0836 | 0.1033 |
| 40 | 5.1487e-07 | 1.0344 | 0.1576 |
| 45 | 9.5129e-07 | 1.0545 | 0.1345 |
| 50 | 2.2191e-06 | 1.1007 | 0.1191 |
Generating an IV-curve based on the equation for the current voltage characteristics, using the values given in the table above, reproduces the experimentally obtained data quite well in the higher bias voltage region, as can be observed in the given image.
However the data doesn't seem to fit that well in the low bias region.
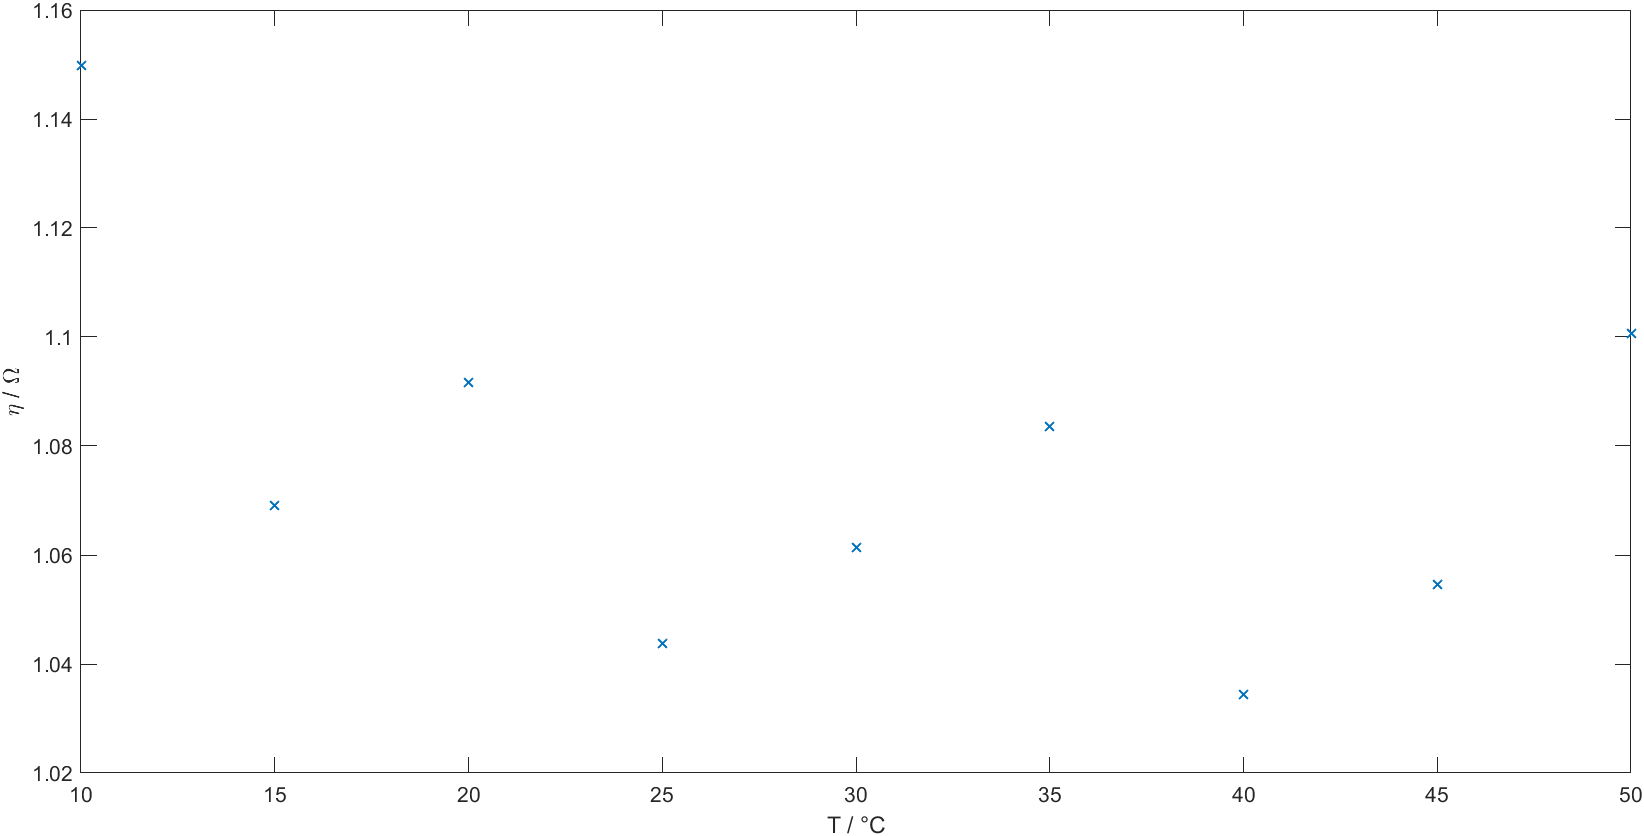
It's hard to observe a definite temperature dependence for the obtained series resistances $R_S$ and the ideality factors $\eta$, as can be seen in the two graphs below.
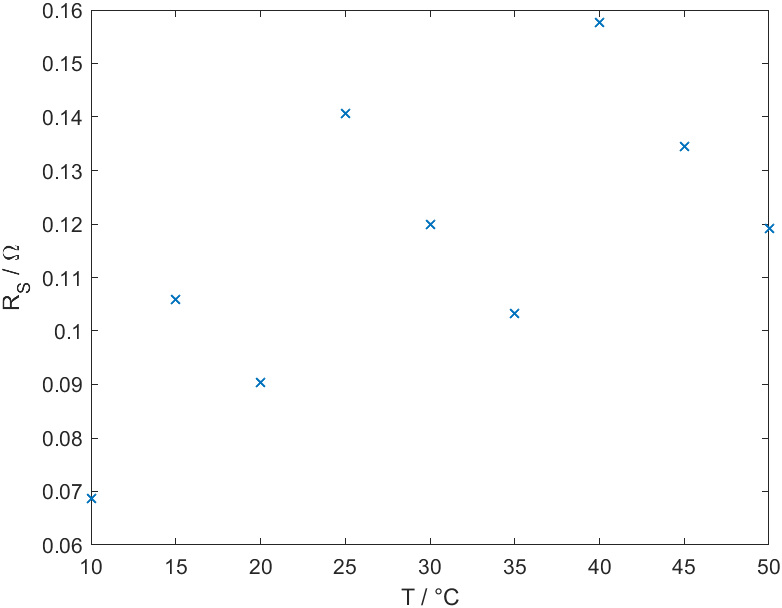
While the series resistance seems to increase with temperature overall, there are several measurement temperatures where the values deviate from this behaviour.
Assuming our Schottky diode was made of Si, we would expect an increase in series resistance with temperature, due to a decrease in electron mobility, as explained in 'I(V) computational conduction model for a SiC-6H Schottky diode' by H. Benmaza et al. To get a clearer picture of the temperature dependence of the series resistance, even more measurements at different temperatures might be useful.
Our calculations show a clear increase in the saturation current with increasing temperatures, as can be seen in the graph below.
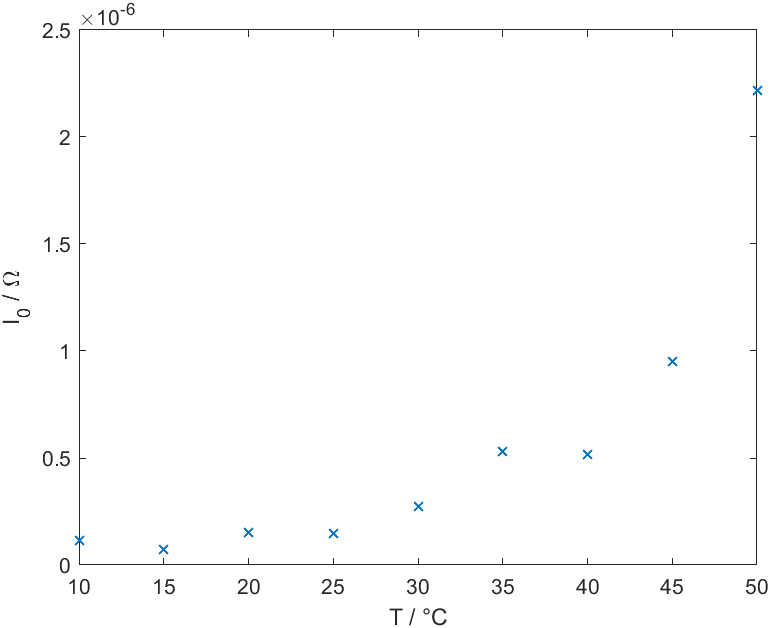
Concerning the temperature dependence of the saturation current in a Schottky diode, according to 'Forward current transport mechanisms in Ni/Au-AlGaN/GaN Schottky diodes' by Dawei Yan et al., one has to take two different transport mechanisms into account: thermionic emission and tunneling.
While thermionic emission dominates in the high voltage regime, in the low voltage regime a substential contribution from trap-assisted tunneling is present. The increase in the saturation current with temperature is then exlained by a decrease in barrier height because of the thermally induced band gap shrinkage effect.