It is often useful to consider the integral of the density of states. For instance, this function can be used to efficiently calculate the chemical potential. The electron density n is the integral of the density of states D(E) times the probability that those states are occupied. The occupation probablility is given by the Fermi function f(E).

This relation implicitly defines the chemical potential μ. If the electron density and the density of states are known, the chemical potential can be determined by guessing a chemical potential, evaluating the integral numerically and comparing the result with the known electron density. If the calculated electron density is too low, a larger chemical potential must be guessed. If the calculated electron density is too large, a smaller chemical potential must be guessed. This process is continued until the chemical potential is determined to the desired accuracy.
The chemical potential at zero temperature is called the Fermi energy Ef. See: Calculating the Fermi energy of a metal from the density of states.
The numerical calculation goes faster if we first integrate by parts.

Here the function K(E) is,

The boundary terms vanish because K(-∞) = 0 and f(∞) = 0. The electron density can then be written as,

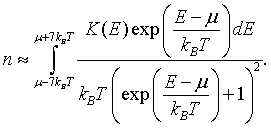
This is a convenient form since the derivative of the Fermi function df/dE is only significantly different from zero in the range from μ - 7kBT to μ + 7kBT. This means that the electron density can be approximated as,

For metals, the integral of the density of states K(E) is a monotonically increasing function.
The form below can be used to calculate the integral of the density of states. The density of states is input as two columns of text in the textbox below. The first column is the energy in eV. The second column is the density of states in unit of eV-1 m-d, where d is the dimensionality (1,2, or 3). The electron density can be calculated from the number of electrons per unit cell and the volume of the unit cell or it can be input directly. After the 'Calculate K(E)' button is pressed, the density of states is plotted on the left and the ingetral of the density of states is plotted on the right. The data for the K(E) plot also appears in the lower right textbox. The first column is the energy in eV. The second column is K(E) in units of m-d. The shaded area indicates the states below the Fermi energy.
| D(E) [eV-1 m-d] | K(E) [m-d] | |||
E [eV] | E [eV] |