Mandelbrot - Help
Author: Gerold Zuderstorfer
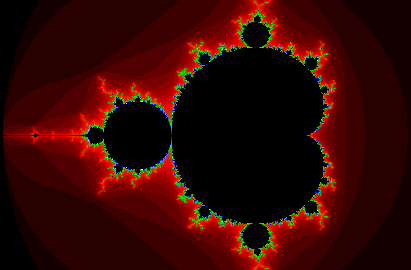
This small program demonstrates the calculation of the Mandelbrot set.
Notes on use
A click (with the left mouse button) or a short touch of the screen opens a menu where you can see and edit the co-ordinates and the zoom factor etc.
Desktop: A click with the right mouse button zooms in.
Mobile: A long touch zooms in.
The calculated image of the Mandelbrot set takes the whole browser window.
What is the Mandelbrot set?
The Mandelbrot set is described by a simple formula in the range of the complex numbers.
The calculation starts with z0 = 0. The constant c contains the co-ordinates of a point in the graphics.
In the first iteration a new number z1 is calculated by applying the formula above. When the iterations are repeated in that way, one of two things will happen:
- The variable z stays in a central area relatively close to the starting point. In this case the constant c is part of the Mandelbrot set.
- The variable z diverges towards infinity. In this case the constant c is not part of the Mandelbrot set.
But what do the different colors in the graphics mean? Points within the Mandelbrot set are colored black (or white). For all the other points the color indicates how many iterations it takes until the point z leaves the central area.
You can read more about the Mandelbrot set on Wikipedia (German: Mandelbrotmenge)
More notes on use
In the upper left corner you can see the following information:
- The real part of the complex number at the mouse cursor (a.k.a. x-axis)
- The complex part of the complex number at the mouse cursor (a.k.a. y-axis)
- The zoom factor
- The run time of the last calculation (in milliseconds)
In the menu you can edit many settings:
- The co-ordinates of the center (plus zoom factor) as numerical values.
- Zoom in or out (or reset zoom).
- Anti-aliasing: A higher value makes the graphic look less "pixelated" (but takes much longer).
- Methode: Choose the method of calculation. Default is the calculation in the browser (JavaScript)
- Coloring: You can choose between different styles. Some are better for higher zoom factors. You can preview the coloring with the button on the right.
- Download: Download the image in PNG-format.
- Recalculate: Restart the calculation after changes.
- Full screen: The image takes the whole screen. Press this button a second time to exit the full screen mode.
Motivation
The program is a byproduct of a simulation software we are developing. It serves as a benchmark test for our calculations. We hope you enjoy it!