
This page describes how to set up a four-wire resistance measurement of a probe of indium tin oxide ITO.
Some basic information about the four-wire resistance measurement can be found here: Four-wire resistance measurement
Before the measurement in the climate chamber started, the resistance at room temperature was measured to identify in which value range the resistance of the probe is for a 2-wire measurement, a 2-wire measurement with constant voltage and a 4-wire measurement and to check if the measurement has an influence on the probe. After connecting the wires with the SMU and the probe, the python code below was used to measure the resistance.
This script requires the Keithley 2600 Python library. Save this in your working directory.
As can be seen in the figure below, the fluctuation of the values for the resistance during the measurements are smaller than 0.5%, that means that the measurement does not have a big influence on the probe.
To figure out the temperature depence of the resistivity and the voltage, the measurements were then performed in a climate chamber, which switched the temperature in 2 K steps from T = (10,0 ± 0,2)°C to T = (40,0 ± 0,2)°C, using the python code below.
This script also requires the Keithley 2600 Python library.
In the figures shown below, which are the measurements for T = 10°C, T = 20°C and T = 40°C, one can see that the values for the resistivity follow a gaussian distribution (line) around the mean, which are laying, depending on the temperature between 2770 Ohm, for high temperatures, and 2735 Ohm for low temperatures. One can see, that the higher the temperature, the lower the resistivity.
resistivity at T = 10°C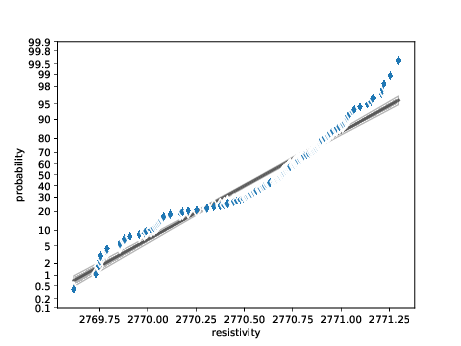
resistivity at T = 20°C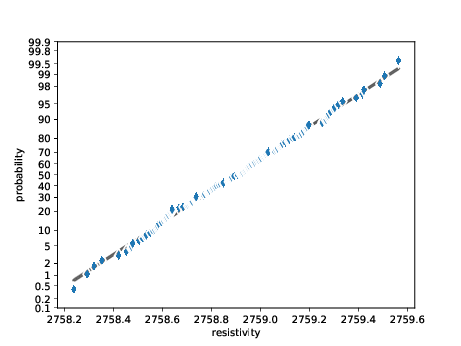
resistivity at T = 40°C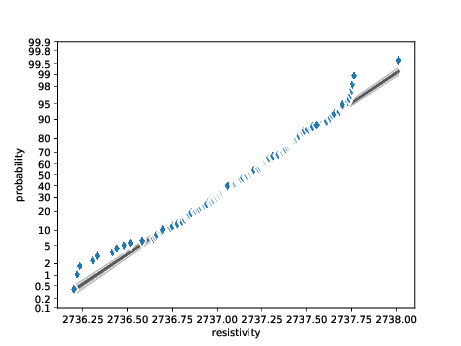
In the following figures, which are again the results of the measurements for T = 10°C, T = 20°C and T = 40°C, one can see, that the voltage at the four-point measurements, follows also a gaussian distribution and has a lower value, the higher the temperature is. The mean values are centered around 27 mV.
voltage at T = 10°C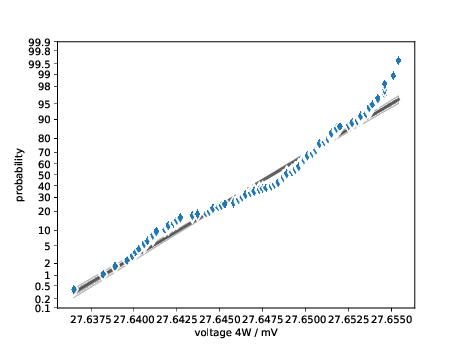
voltage at T = 20°C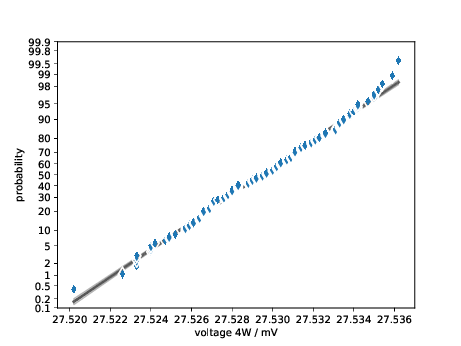
voltage at T = 40°C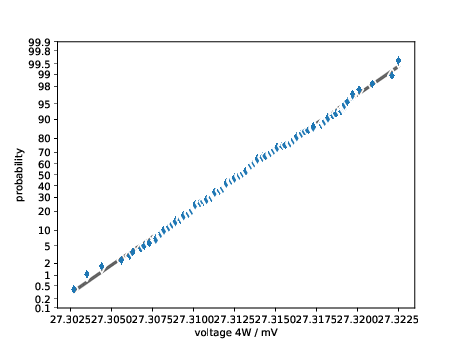
As a summary, the next figure shows the temperature depence of the resistivity and the voltage from 10°C to 40°C.
voltage and resistivity over temperature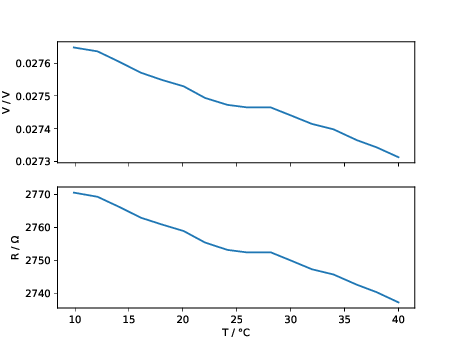
Semiconductors show another temperature behaviour than metals. In metals the resistivity increases with higher temperature. In semiconductors the conductivity increases with higher temperature, that means that the resistivity decreases. The higher the thermal energy, the more electrons overcome the band gap between the valence band and the conduction band. The conductivity in the valence band increases, which means that the resistivity decreases. In metals the conduction band and the valence band overlap, so a metal always has charge carriers. When the temperatur increases, the collision of the electrons and therefore the resistivity increases.
The data of the measurements can be found here: