The goal of this excercise was to examine a (large) yellow and green Light Emitting Diode (LED). The KEITHLEY 2636A sourcemeter was used to record the Current-Voltage Characteristic curve of the LEDs. To control the sourcemeter, a computer with provided python scripts was used. The scripts can be found at the end of the page. A guide on how to get started with computer supported measurement techniques using python can be found here.
The following two points will be examined:
A LED is able to generate light by recombination of electron-hole pairs in the pn junction while being forward biased. But it also works like a small solar cell, because the pn junction has to be exposed for the generated light of the LED to be seen. By shining light, that is electromagnetic radiation, on the LED, a photocurrent is introduced due to the photovoltaic effect. The photocurrent has flows into the opposite direction of the forward biased diode current, thus appearing to be a net "negative" current.
Prior to starting measurements, the sourcemeter has to be set up. The program "KeithleyV15.py" copied to the same folder as the other measurement scripts. The data was captured with the python script "sweepdiode_withmultipleranges.py" to ensure that the range of the sourcemeter would be optimal for any given current. Using the script "plot_diodesweeps_withmultipleranges_cleanedup.py" the data can then be displayed as one characteristic U/I curve over different current intervals.
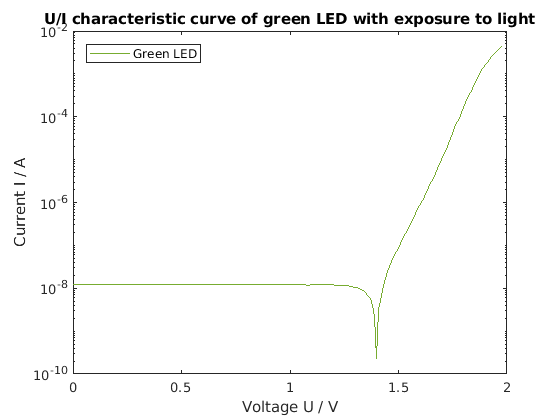
The y-axis is displayed logarithmically to be able to show more detail in the low current regime. Before the LED turns on, the "negative" photocurrent can be seen. Because a logarithmic plot cannot display negative numbers, the data is mirrored over the x-axis, displayed as a positive current, while in fact it is not! At about 1.4 V the LED turns on, and an exponential growth of current can be observed as expected. For very high currents and voltages a slight flattening can be observed, which is because more voltage drops off at the series resistance of the diode. Since the current has to pass through the enitre diode, the doped silicon acts as a resistor, therefore creating an "intrinsic" resistor. This phenomena cannot be avoided since it is a property of the diode.
The recorded data can be found here:
In order to mitigate the photocurrent, all subsequent tests were done in a storage box for glasses that was available at the time, and was then covered with jackets and jumpers to block out as much electromagnetic radiation as possible. This setup is not ideal, and for more exact results the experiment should be repeated in a dark environment. Again, the python script "sweepdiode_withmultipleranges.py" was used to measure the U/I characteristic curve, and the data was stitched together using the script "plot_diodesweeps_withmultipleranges_cleanedup.py" to display one resulting characteristic curve. Using MATLAB, the data from both LEDs was combined into a plot of the U/I characteristic curve.
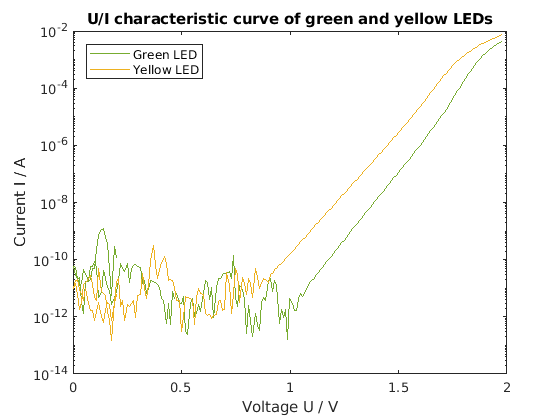
One can observere noise in the low current range. The cause of the noise is not entirely known, since it could stem from incoming light not being entirely blocked out, or as a result of the measurement setup with the sourcemeter. At a voltage of about 0.9 V the yellow LED switches on, whereas the green LED turns on at about 1.1 V. This is likely due to the LEDs having a different surface area. Measurements of the diodes in a Scanning Electron Microscope (SEM) could confirm this hypothesis. One can also observe the U/I curve for the green LED rising slightly faster than for the yellow LED. This is likely due to a different non-ideality factor for both LEDs. For high currents and voltages the characteristic curves start to flatten, which is again due to the series resistance of the diode acting like a resistor in series to the "idealized" diode.
The data for the yellow LED can be found here:
The data for the green LED is given below:
Library script to establish proper communication and usage of the sourcemeter:
Script used to control the sourcemeter and to record measurement data:
Script used to record the U/I characteristic curve over several sourcemeter ranges:
Script to combine the measurements for multiple ranges into one contiuous data set:
Ideas for future experiments