In this experiment the voltage-temperature characteristics of a Zener diode were measured using a Vötsch VT4002 climate chamber to establish the temperature and a Keithley 2600 Series Sourcemeter to measure the voltage across the diode at a specified current.
The aim of the experiment was to use the voltage-temperature dependence to determine the non-ideality factor η of the diode based on the Shockley diode equation and compare the values to those calculated from a current-voltage measurement.
In general, the current-voltage characteristics of a diode are described by the diode equation:
$$ I = I_S\left(\exp(\frac{eV}{\eta k_B T}) - 1\right)\hspace{0.5cm}\text{[A]}$$Where I is the current, Is is the saturation current, V is the applied voltage and η is the non-ideality factor.
The non-ideality factor η describes the deviation of a real diode from the ideal behaviour and it typically varies from 1 to 2 (for the ideal diode η = 1), depending on the fabrication process and semiconductor material. The factor mainly accounts for carrier recombination as the charge carriers cross the depletion region.
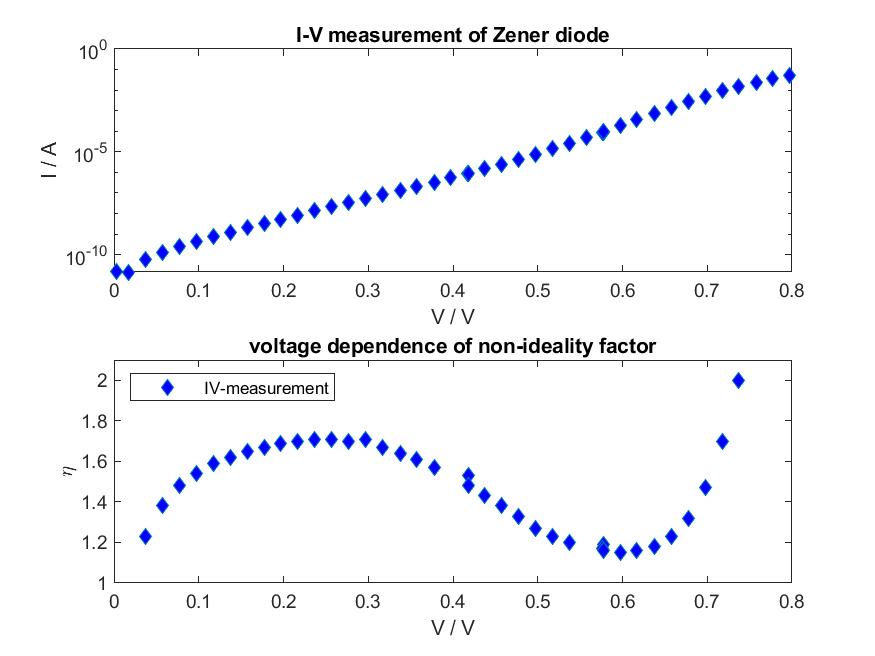
However, it turns out that the current-voltage characteristics of real diodes are still more complicated and cannot be described properly by a constant non-ideality factor. Apparently, the non-ideality factor has some voltage-dependence.
$$\eta = \eta(V)$$Assuming such a dependence of the non-ideality factor, for a measured current-voltage curve the function η(V) was calculated such that the measured data is correctly described by the equation:
$$ I = I_S\left(\exp(\frac{eV}{\eta(V) k_B T}) - 1\right)\hspace{0.5cm}\text{[A]}$$
The data was taken from former measurements. The behavior of η(V) starts out at values close to 2, then moves towards almost ideal behavior (η close to 1) until it eventually shoots up at about 0,7 V. This diverging behavior can be attributed to the internal series resistance of the diode that limits the current flowing through the diode.
Another possible approach for determining the non-ideality factor is to start from the voltage-temperature measurements (see Experimental implementation).
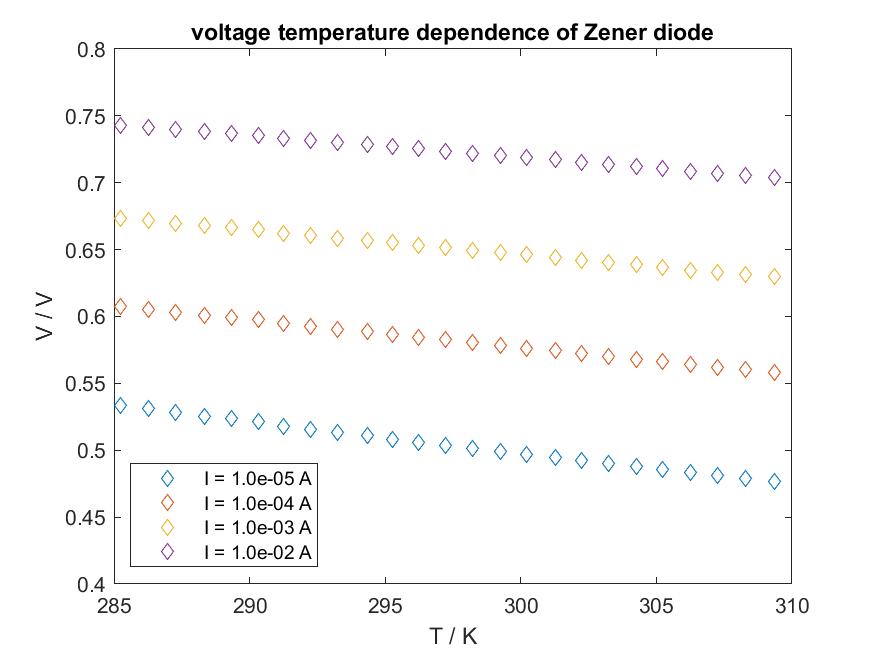
The non-ideality factor can be calculated from the intercept of the voltage-temperature curves with the y-axis at T = 0 K by rearranging the diode equation to a form that expresses the voltage V for a given current as a function of temperature T.
Since the exponential term already dominates for small forward currents, the “-1”-term can in general be neglected, resulting in the expression:
$$ V = \eta \frac{k_b T}{e}(\ln{I_s}-\ln{I})$$Writing out the saturation current I_s in terms of materials properties results in the following expression for V(T):
$$ V= \eta \frac{E_g}{e}-T\frac{\eta k_b}{e}(\frac{7}{2} \ln{T}-\ln{I}+\ln{Q})$$With Q being a function of all the remaining material specific properties like mobility μ, effective mass m*etc.
$$ Q = A \sqrt{k_B e} \left(\sqrt{\frac{\mu_p}{\tau_p}}\frac{1}{N_D}+\sqrt{\frac{\mu_n}{\tau_n}}\frac{1}{N_A}\right) 4 (\frac{k_B}{2 \pi \hbar^2})^3(m_p^* m_n^*)^{3/2}$$This expression is approximately linear in T.
Since for silicon the bandgap Eg is known (Eg = 1.12 eV) and its temperature dependence is negligibly small, by determining the intercept of the temperature-voltage dependence the non-ideality factor η can be calculated.
$$\eta =\frac{intercept* e}{E_g}$$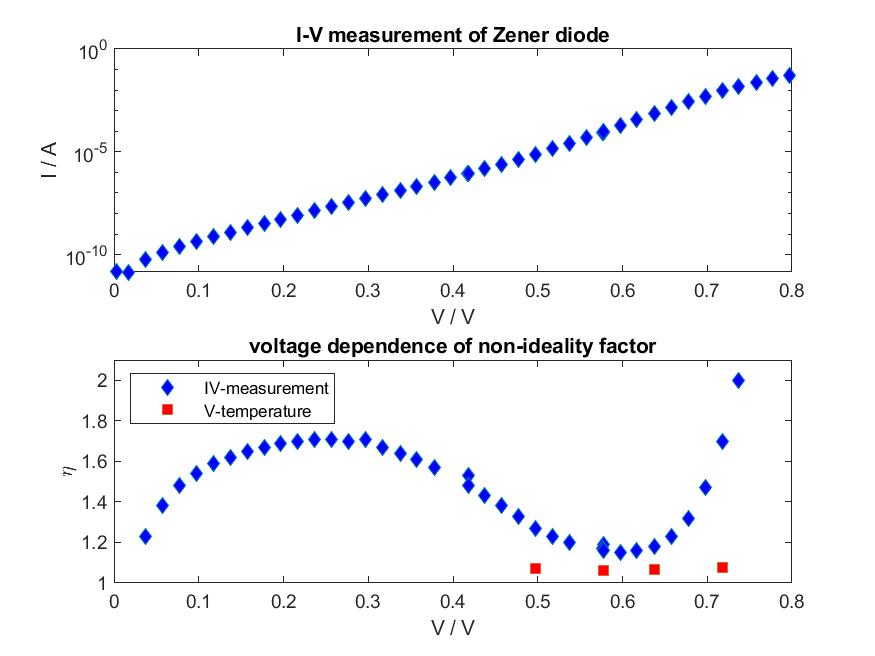
However, it turns out that the intercept of the curve is almost independent of the current I. This leads to a more or less constant non-ideality factor η in the investigated current-range.
This does not agree with the expected η-dependence calculated from the IV-curves (Approach 1).
This inconsistency can lead to two different conclusions:
Maybe the deviations from ideal behavior in the IV-curve are not only due to a varying non-ideality factor, but also due to self-heating of the diode during measurement.
Ideas for future measurements
A Python program was used to execute the voltage-temperature measurements.
Download the Python libraries voetsch.py and KeithleyV15.py and save them in your directory. Put the following script in the same directory.
In this script, first the climate chamber and the sourcemeter are initialized, setting the source meter to current source mode. The script then steps through a temperature range between 10 °C and 40 °C, employing the “go_to_temperature”-function that takes a settling time into account. At each temperature point the voltage is measured at 4 different currents, starting at the smallest current in order to prevent the diode from heating up.
The measurement data for the voltage-temperature curve can be found here: