Introduction
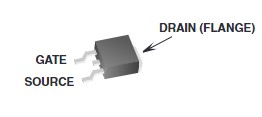
Metal-Oxide-Semiconductor Field-Effect Transistors (MOSFETs) are fundamental components in modern electronic devices, playing a crucial role in switching and amplification applications. Understanding the characteristics of MOSFETs is essential for their effective use in circuits. This lab focuses on measuring and analyzing the Saturation and Transfer Characteristics of a power n-channel MOSFET. For this experiment we used a RFD16N05SM n-channel power MOSFET, see details at Datasheet. Figure 1 shows an image of the used device with the drain, source and gate contacts shown.
 .
.
From this measurement, we will determine the Threshold Voltage and in addition we also measure the Zener Breakthrough. The structure of the Sections will be the same. In the first part of the Section we will discuss the basics and want to give an explanation about what we expect to happen. The second part will consist of an analyzis and discussion of the measurement data. The last part shows the code used for the measurement in a text area. The Appendix at the end of this page contains the Python code used to generate the Figures shown on this page.
Saturation Characteristics of a MOSFET
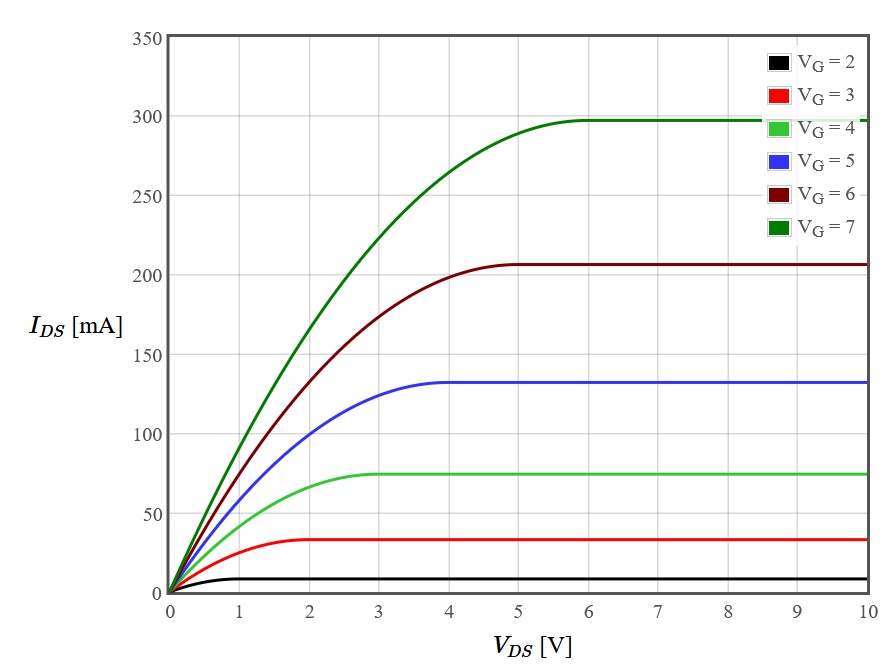
To get familiar with the setup we want to measure the Saturation Characteristics of a power MOSFET. In the following we first want to discuss the basics by analyzing the theoretical results predicted by the gradual channel approximation shown in Figure 2. The graph is taken from Transistor characteristics of a n-channel MOSFET.
 .
.
To measure the Saturaction Characteristics of a MOSFET we have to apply a voltage between drain and source as well as between gate and source. Than we have to plot the resulting drain-source
current versus the applied drain-source voltage for every applied gate-source voltage, which results in the plot of Figure 2.
The x-axis of the plot represents the drain-source voltage ($V_{DS}$) in
volts and the y-axis the drain-source current ($I_{DS}$) in milliamps. Every plotted curve corresponds to a gate-source voltage ($V_{GS}$), the values can be seen in the legend. The curves shown in Fig. 2 follow the
gradual channel approximation which is determined by the following equations:
$I_{DS}$ is the drain-source current, $V_{GS}$ is the gate-source voltage, $V_{T}$ is the threshold voltage and K is a material specific constant (described in equation (4))
depending on the channel width $W$, the channel lenght $L$, the oxide capacitence $C_{ox}$ and the charge mobility $\mu_{n}$.
Equation (1) describes the behaviour of a MOSFET when the gate-source voltage is smaller than the Threshold Voltage. In this case no current flows between source and drain because
no electrons are available in the channel.
The plot is diveded into two regions. The linear region for small drain-source voltage is the so called Ohmic region and is described by equation (2), where the current is rising
linearly with increasing drain-source voltage. The constant part of the plot is called Saturation region and is described by equation (3), where the current stays constant with increasing
drain-source voltage.
To get the Data needed we connect channel A of the Keithley 2600 Series Sourcemeter with the drain and source contacts of the MOSFET and apply a voltage between 0V and 2V and measure
the resulting source-drain current. Gate and source contacs are connected with channel B and a voltage between 3.2V and 4.2V is applied.
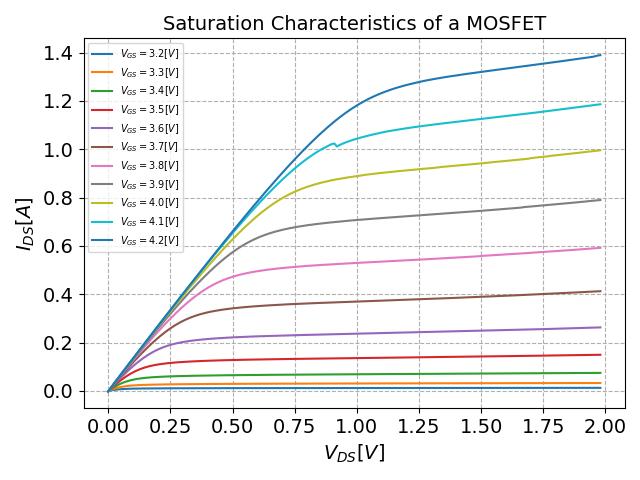
If we use this setup in combination with the controlling python code (see text area below) we get an excel file including the applied voltages and measured currents. If we plot the applied
drain-source voltage (data, column 1) against the meausred drain-source current (data,
column 2) for every gate-source voltage (data, column 3) we get the plot seen in Figure 3.
The python used code for generating the plot out of the data can be seen in the text area in the appendix.
 .
.
The labeling of Fig. 3 is the same as that of Fig. 2, except the y-axis of Fig. 3 is in amperes. Comparing these two graphs, we observe that the measured curves closely align with our
expectations. Both the Ohmic and saturation regions are evident. However, a closer inspection reveals that the saturation region of Fig. 3 is not perfectly constant. This deviation
occurs because the channel length shortens as the drain-source voltage increases. This effect is more pronounced at higher gate-source voltages, where more electrons
are present in the channel, allowing more current to flow at the same $V_{DS}$ thereby increasing the deviation from a constant current.
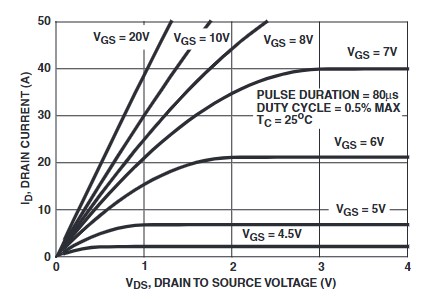
Figure 4 shows the saturation characteristics of the device used from the datasheet. If we compare this graph with Figure 3, we have to admit that we don't really come close to the graph
from the datasheet. The reason for this is that we were not able to achieve higher currents and voltages with this setup. However, it can also be assumed that the manufacturer is being
optimistic when comparing the theoretical curves with those from the datasheet. It is possible that the curves in the data sheet are only the results of simulations. Verifying this assumption
would be a good experiment for other groups to approximate the curve from the datasheet.
In the text area below is the Python code used to generate the data for the Saturation Characteristics of the MOSFET. The Keithley 2600 Python library is used to communicate with the sourcemeter, and the eLabFTW_config_api2_semilab library is used to upload the acquired data directly to the ELAB page. These libraries have to be in the same directory as the used Python code. Below the text area the python code and the measured data are linked.
Determination of the Threshold Voltage
In this Section we want to determine the Threshold Voltage $V_T$ of an n-channel power MOSFET. We start by measuring the Transfer Characteristics using a sourcemeter in combination with
a controlling python code (text area at the end of the section). Connect channel B of the sourcemeter to the drain and source contacts, and channel A to the gate and source contacts.
The orientation of the contacts can be obtained from the Datasheet. To obtain
the Transfer Characteristics, we need to measure the source-drain current ($I_{DS}$) as a function of the gate-source voltage ($V_{GS}$) for different drain-source voltages ($V_{DS}$).
First, apply a gate-source voltage between 3.2V and 4.5V using channel A of the sourcemeter. Then, apply a drain-source voltage between 0V and 1.3V and measure the resulting source-drain
current with channel B of the sourcemeter. By plotting the gate-source voltage (data, column 1) against the measured drain-source current
(data, column 4) for various drain-source voltages (data, column 3) shown in the legend,
we obtain the Transfer Characteristics as depicted in Figure 5.
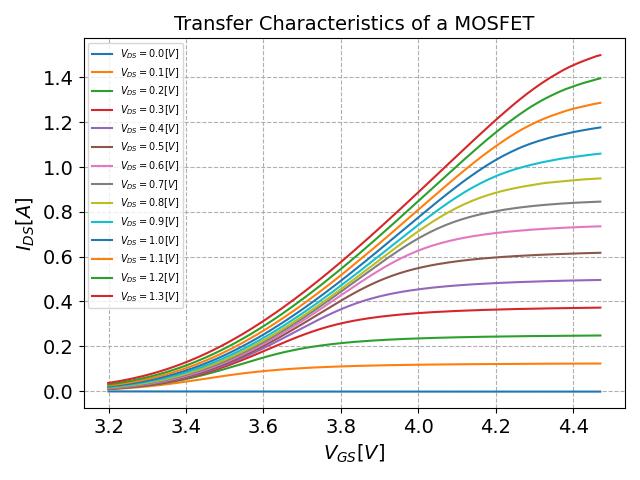
From the Transfer Characteristics one can estimate how effectively a MOSFET can control the current flow from drain to source. This property is called transconductance ($g_{m}$) and is defined
as $g_{m} = \frac{dI_{DS}}{dV_{GS}} $, which is the rate of change of the drain-source current with respect to the gate-to-source voltage at a constant. The experimental determination
of the transconductance would fit well as target for future labs on MOSFETs.
However, target for this experiment is to determine the Threshold Voltage ($V_{T}$) from the Transfer Characteristics. $V_{T}$ determines at which applied $V_{GS}$ current flows from source to
drain and is therefore crucial for the switching characteristics of the MOSFET.
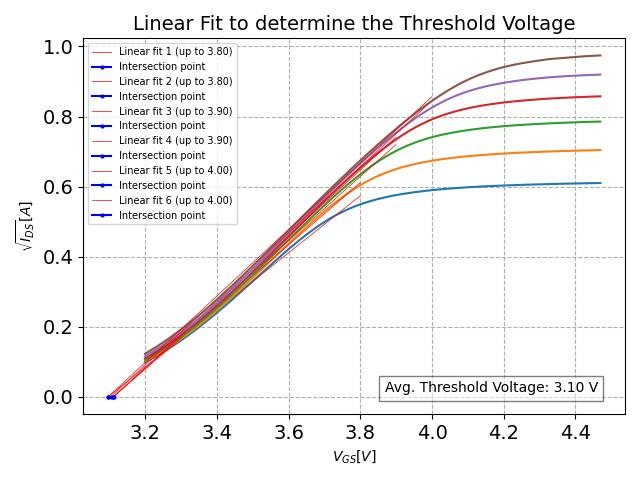
To determine the Threshold Voltage of an MOSFET, we use the same data as for the Transfer Characteristics. The primary difference is that we plot the sqare root of the measured drain-source current ($\sqrt{I_{DS}}$)
on the y-axis. The threshold voltage is determined by fitting the linear region of the curve and extrapolating back to $\sqrt{I_{DS}} = 0$. The point where the line intersects the x-axis represents the Threshold
Voltage.
For clarity, we selected six curves between 0.3V and 0.8V and determined the threshold voltages for each of them. The resulting graph is displayed in Figure 6. The averaged threshold voltage value, $V_{T} = 3.10 V$,
is shown at the bottom right of the graph. This explains why the plot of the Transfer Characteristics doesn't start at zero drain-source current, as the measurement begins at $V_{GS} = 3.2V$, which is above the
Threshold Voltage. For more accurate results in future measurements, $V_{GS}$ should start at less than $3.10V$
The Python code used to determine the Threshold Voltage and create the figures in this section is included in the Appendix.
In the text area below is the Python code used to generate the data for the Transfer Characteristics of the MOSFET. The Keithley 2600 Python library is used to communicate with the sourcemeter, and the eLabFTW_config_api2_semilab library is used to upload the acquired data directly to the ELAB page. These libraries have to be in the same directory as the used Python code. Below the text area the python code and the measured data are linked.
Measurement of the Zener-Breakdown
According to the Datasheet, the MOSFET is protected by a Zener diode against excessive voltage. In this section, we measure and determine the Zener breakdown voltage. The setup is the same as for measuring the transfer characteristics, but we unlock the high voltage mode of the sourcemeter to apply voltage above 40 volts and we limit the current to 0.01 amperes. By plotting the drain-source voltage ($V_{GS}$) (data, column 1) against the measured drain-source current ($I_{GS}$) (data, column 2) for various gate-source voltages ($V_{DS}$) (data, column 3) shown in the legend, we obtain the plot in Figure 7.
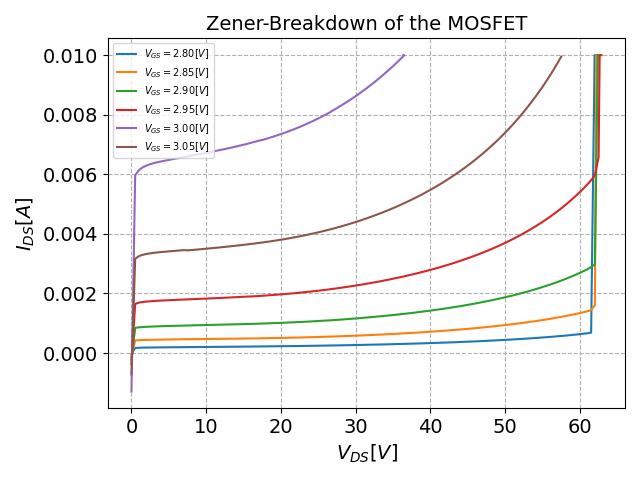
The measurement reveals that the Zener diode protection mechanism activates around 60V gate-source voltage. This is evident from a sharp increase in gate-source current at this
voltage across different drain-source voltages. This consistent breakdown voltage indicates effective gate protection against high voltage spikes, ensuring the MOSFET's reliability
and longevity. The plot illustrates how the gate current remains low until the Zener breakdown voltage, after which it rises sharply, confirming the Zener diode's clamping action.
The Python code used to create Figure 7 is included in the Appendix.
In the text area below is the Python code used to generate the data for the Zener-Breakdown Characteristic. The Keithley 2600 Python library is used to communicate with the sourcemeter, and the eLabFTW_config_api2_semilab library is used to upload the acquired data directly to the ELAB page. These libraries have to be in the same directory as the used Python code. Below the text area the python code and the measured data are linked.
Appendix
The following Python code is used to generate the graphs shown on this page. The files variable path must be adapted to the location where the created data or the downloaded data from this page are stored. Ensure that only usable data files are in the specified folder, as the code will read all files within that directory.