Two different materials were investigated with the scanning electron microscope (SEM) at the institute of solid state physics of TU Graz:
Graphite |
Carbon Foam |
|---|---|
| Graphite crystallizes in hexagonal form and has three carbon atoms in the conventional unit cell. An animation of the unit cell can be found here. This is the most stable form of carbon under standard conditions and occurs therefore naturally. Under higher pressure and temperature it can convert to diamond. The individual layers of graphite are called graphene. Atoms in the plane are bonded covalently, wherefore graphite is electrical conductive and acts like a metal. Because of the layered structure of graphite, the thermal and acoustic properties are very anisotropic. Graphite is mainly used as refractory, battery and in the steelmaking process. Graphite has a density of 2.26 $\mathrm{g / cm^{-3}}$ and a electrical resistivity of 7.84 $\mathrm{\mu \Omega m}$. More information can be found in wikipedia. | Carbon foam is characterized by a carbon content $>97\%$, an electronic conductivity of up to 2800 $\mathrm{Sm^{-1}}$ and an Young's modulus of up to 2.1 GPa. It is produced by following procedure: Dicyclopentadiene (DCPD) is in an emulsion with $H_2O$, which polymerizates through Ring-Opening Metathises Polymerization (ROMP). This results in polydicclopentadiene (pDCPD) foam, which results after oxidation and pyrolysis to the final carbon foam. In industry, carbon foam can be used for exhaust systems or aerospace tooling. More information can be found in the paper. |
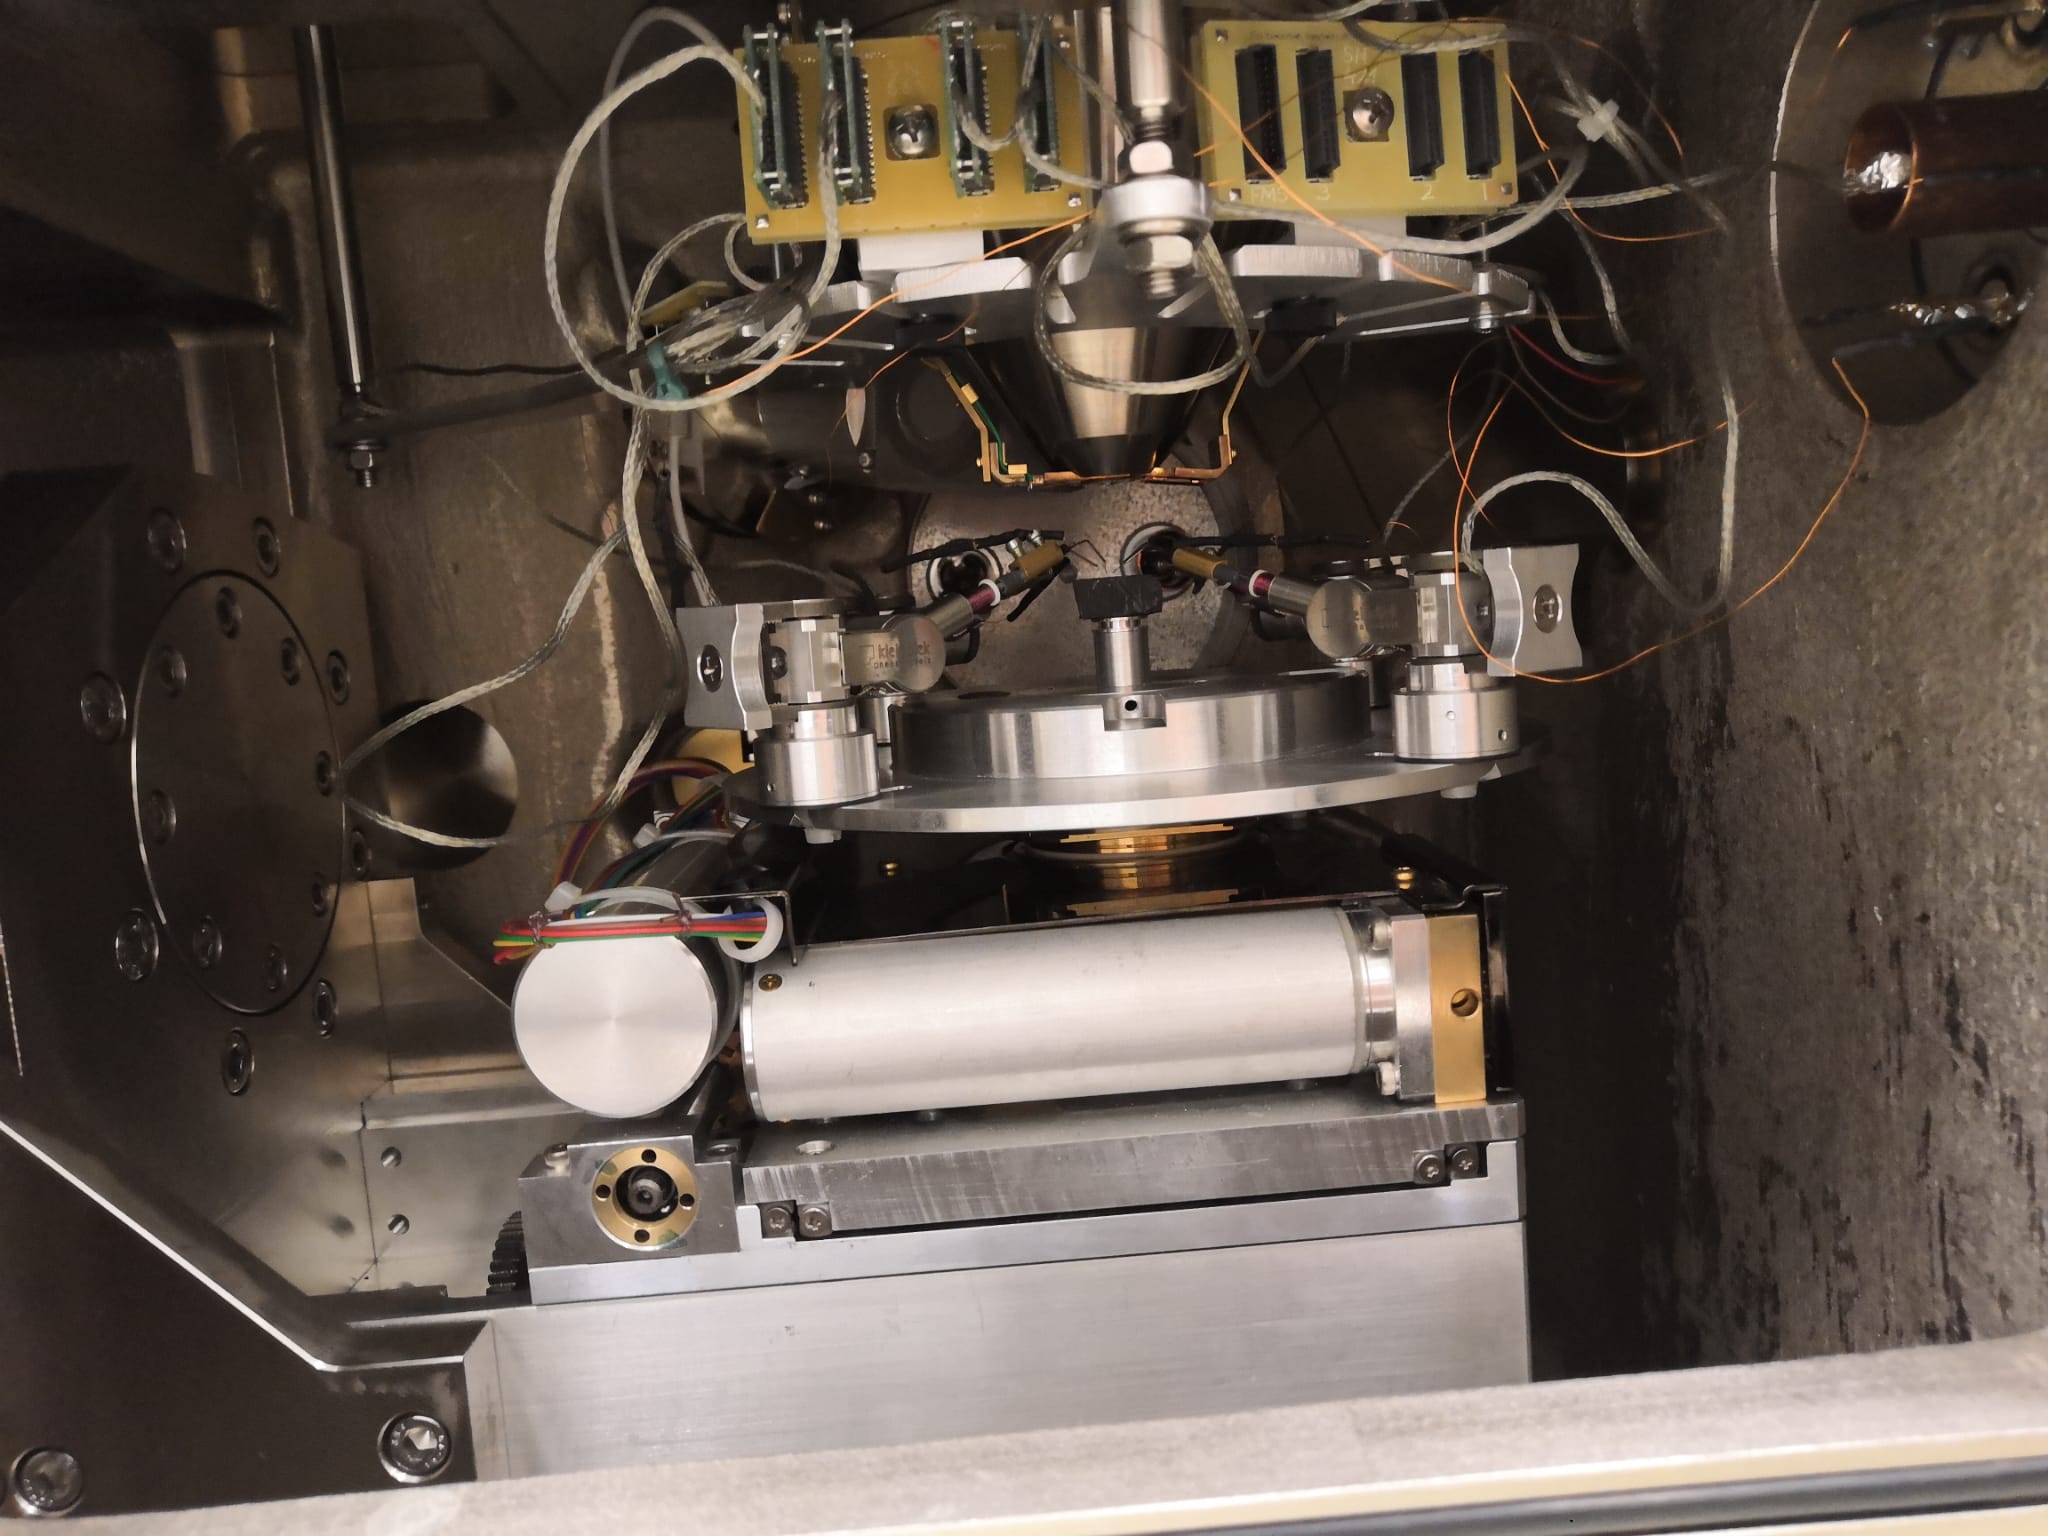
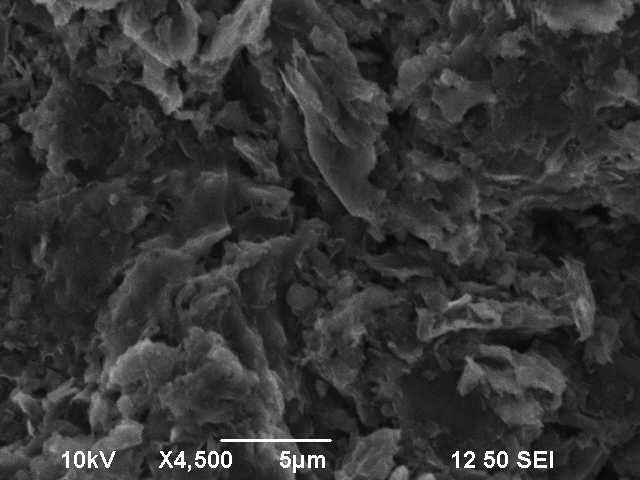
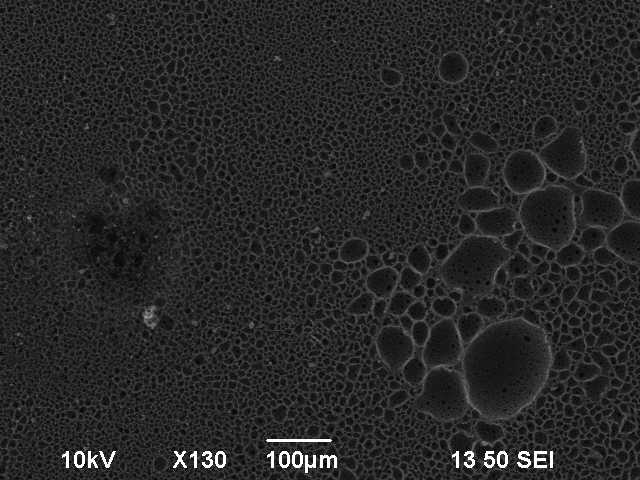
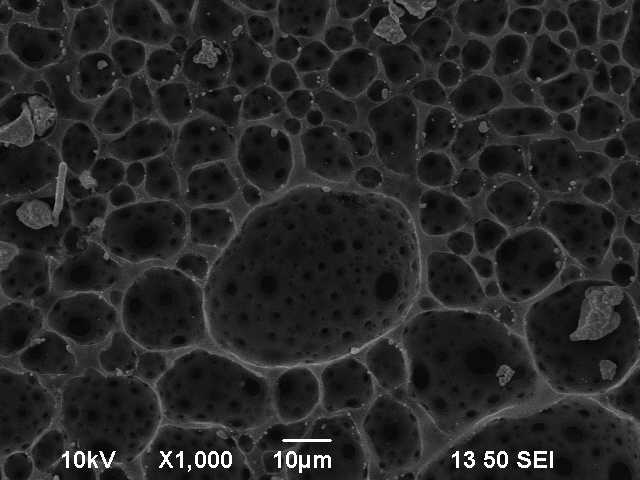
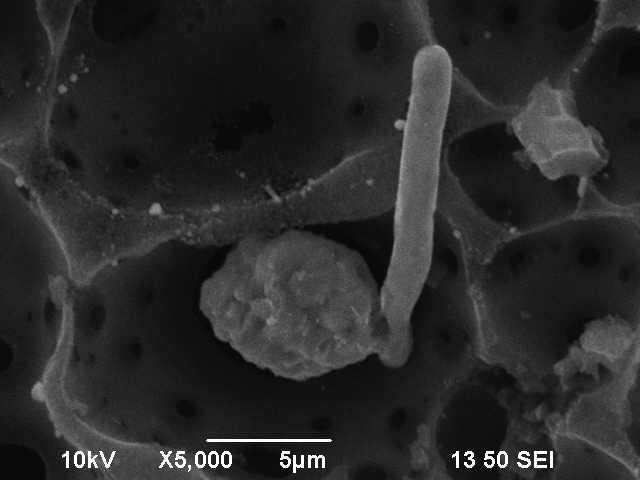
Before investigation by SEM, the density was calculated by archmides principle. This leads to a density of 1.99 $\mathrm{g / cm^{-3}}$, which is lower than the literature value of 2.26 $\mathrm{g / cm^{-3}}$. This lies in the fact that we don't have a single crystal, which was also seen when we broke the graphite rod and there wasn't a clean break breakpoint. Remark to working with carbon foam: You have to very careful, since it is very fragile. If you put it on adhesive tape on the sample holder of the SEM, you probably won't get it off in one pice. Figure 1 shows the vaccum chamber inside the SEM, whith the graphite on the sample holder. Figure 2 shows the graphite in the SEM with a magnetization of 4500. The visible flakes are another indicator for a polycrystalin sample. Figure 3 shows the carbon foam in three different resolutions.
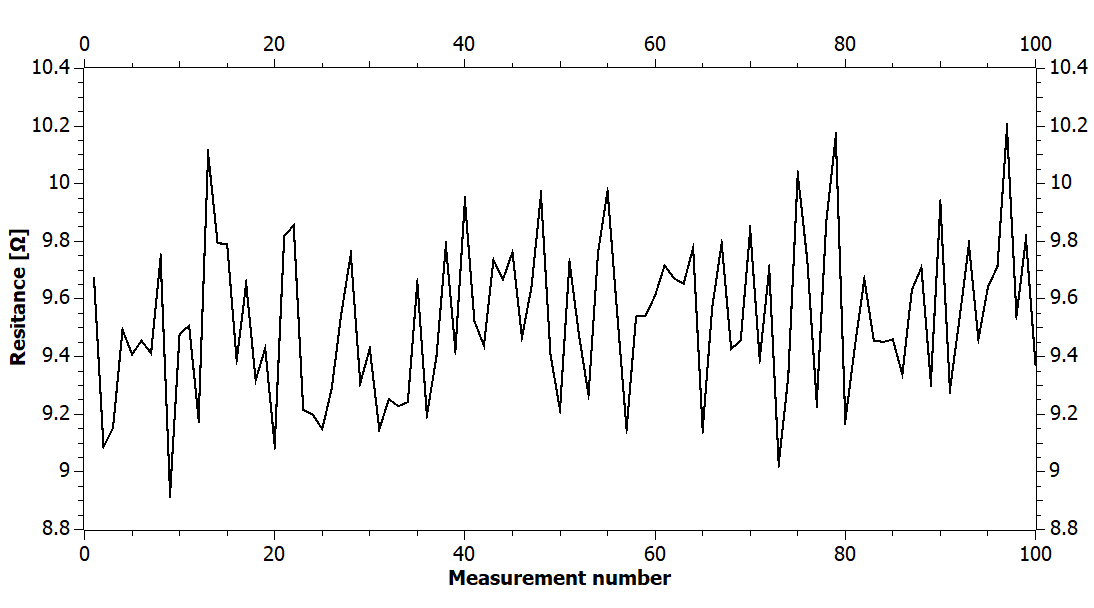
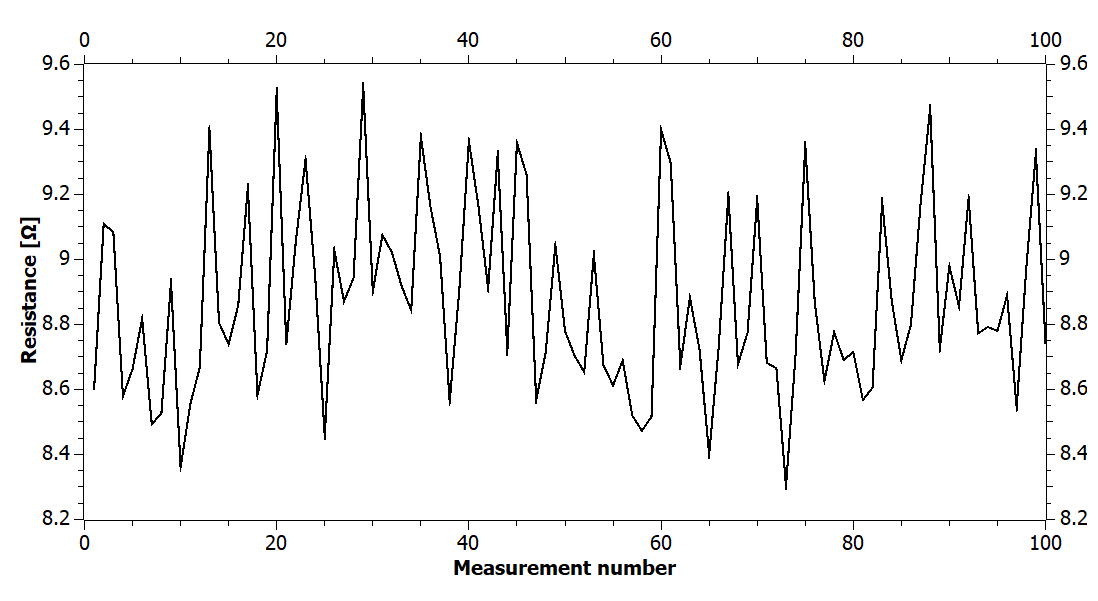
To determine the resistance and resistivity of the graphite block and the carbon foam, four-point measurements were used. This method eliminates the contact resistance from the measurement by supplying current via the outer two electrodes, and measuring voltage with the inner two electrodes. More detailed information about this method can be found here. With the code given below, voltage and current were measured via the Keithley 2600 Series Sourcemeter, from which the resistance was calculated. Measurements were done in the above mentioned four-point mode, as well as the simple two-point mode, which does not neglect contact resistances. For each mode, the resistance was measured 100 times to get more meaningful results. Measurements for both, the graphite and the foam, are visible in the figures below. The four-point measurement leads to an average resistance of $R_{graphite} = (8.87 \pm 0.29) \ \Omega$ for graphite, and $R_{foam} = (9.53 \pm 0.27) \ \Omega$ for the foam. The two-point measurements lead to slightly higher values (namely $R_{graphite} = (11.92 \pm 0.17) \ \Omega$ for graphite and $R_{foam} = (15.11 \pm 0.15) \ \Omega$ for the foam). The resistances for the graphite and the foam at room temperature are similar, differing less than $1 \ \Omega$. For both, the difference from 4-point and 2-point measurements are visible, as the contact resistance leads to slightly higher overall resistance in the 2-point measurements. The contact resistance values are in the order of the measured resistance of the material and thus not overly significant. Noticeably, the values of 4-point and 2-point measured resistance differ more in case of the carbon foam, which may be due to worse contact due to porosity and thus higher contact resistance.
 |
 |
From the average resistance values for the 4-point measurements the resistivity was calculated with the formulas provided here. As our graphite block is much thicker than the distance between the electrodes $a$ (measured distance: $1.5\ mm$) in the 4-point measurement, the formula for thick films was used: $$\rho=\frac{2\pi aV}{ I}\,\,\Omega\text{ m}.$$ The thickness $t$ (measured distance: $0.85 \ mm$) of our used carbon-foam was in range of the distance between electrodes $a$, and thus a modified formula was used: $$\rho=\frac{2\pi V}{ I}\left(\frac{1}{a}+\frac{2}{\sqrt{a^2+4t^2}}-\frac{1}{\sqrt{a^2+t^2}}\right)^{-1}\,\,\Omega\text{ m}.$$ For both formulas, $V$ is the voltage, $I$ is the current, $a$ is the distance of the equispaced electrodes and $t$ is the thickness of the foam. Using these formulas, following values for the resistivity were obtained: $$ \rho_{graphite}= (8.36 \pm 0.27) \ \Omega\text{cm}$$ $$ \rho_{foam}= (6.18 \pm 0.18) \ \Omega\text{cm}$$ Compared to the values for the resistivity of graphite, that can be found in the info-box above, our calculated value is orders of magnitude higher. Even though our sample is slightly less dense than the theoretical value for density, this does not explain the high value for resistivity. The calculated resistivity of the carbon foam is also in a similar range. Information about carbon foam can also be found in the info box above.
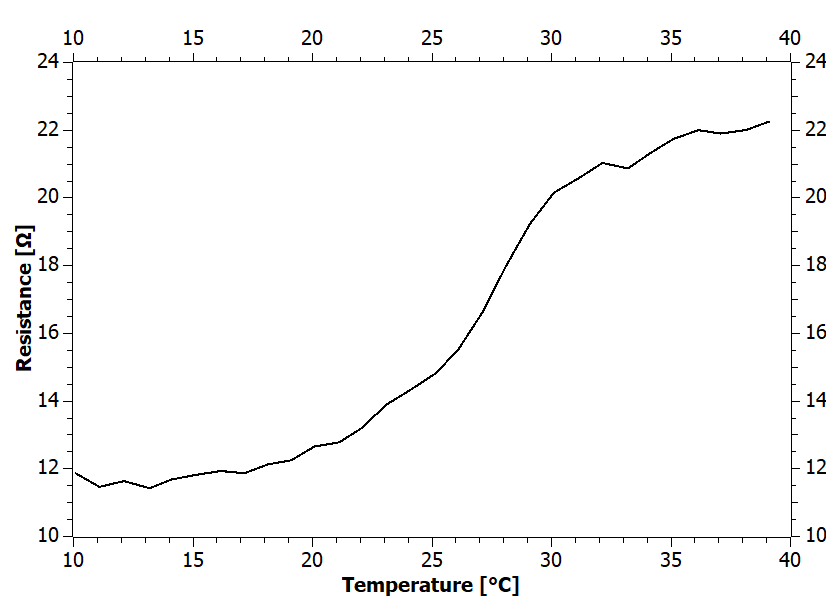
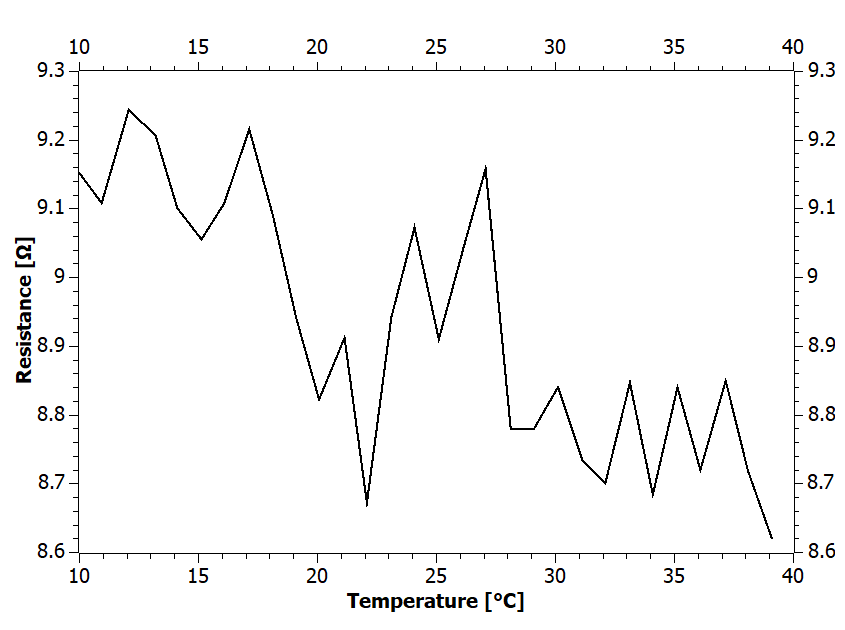
The temperature dependence of the resistivity of both materials was to be determined. For this, 4-point resistance measurements were done in a Vötsch VT4002 climate chamber, where the temperature was varied from $10°C$ to $40°C$. For each temperature a waiting time of $60 \ s$ was implemented, in order to ensure a preferably constant temperature, as it tends to dampingly oscillate around the wanted value. This was regulated by the python code below, with 50 4-point resistance measurements being done for every temperature step, with the average value of the resistance being returned for each temperature step. As visible in the figures below, the behavior of the resistance for different temperatures varies drastically for graphite and for carbon foam. For the carbon foam the resistance rises with rising temperature, a behavior that is usually observed in metals. The graphite shows slightly decreasing but quite fluctuating trend, which could be due to uncertainties, as the previously obtained uncertainties for the resistance ($\sim \ 0.2 - 0.3 \ \Omega$) are approximately in range of the fluctuations. Decreased resistance with increased temperature is a typical behavior for non-metals. One possible explanation for this increasing trend of the curve may be structural change of the foam with increasing temperature. Since the carbon foam consists of many "bubbles" of air, these bubbles may expand with an increase of temperature and thus cause a change in structure. To see whether or not this is the case, it may be necessary to measure the temperature dependence of the resistivity in reversed order - starting from the highest and going to lower temperatures. Because the caused change in structure may not be reversible, a different behavior of the temperature dependent resistivity may be observed. Further investigation regarding the temperature dependence of the carbon foam may thus be necessary, in order to review the observed behavior.
 |
 |
References
This is a Martin Hasenburger and Tamara Terzic Production, Dezember 2021.