|
| |
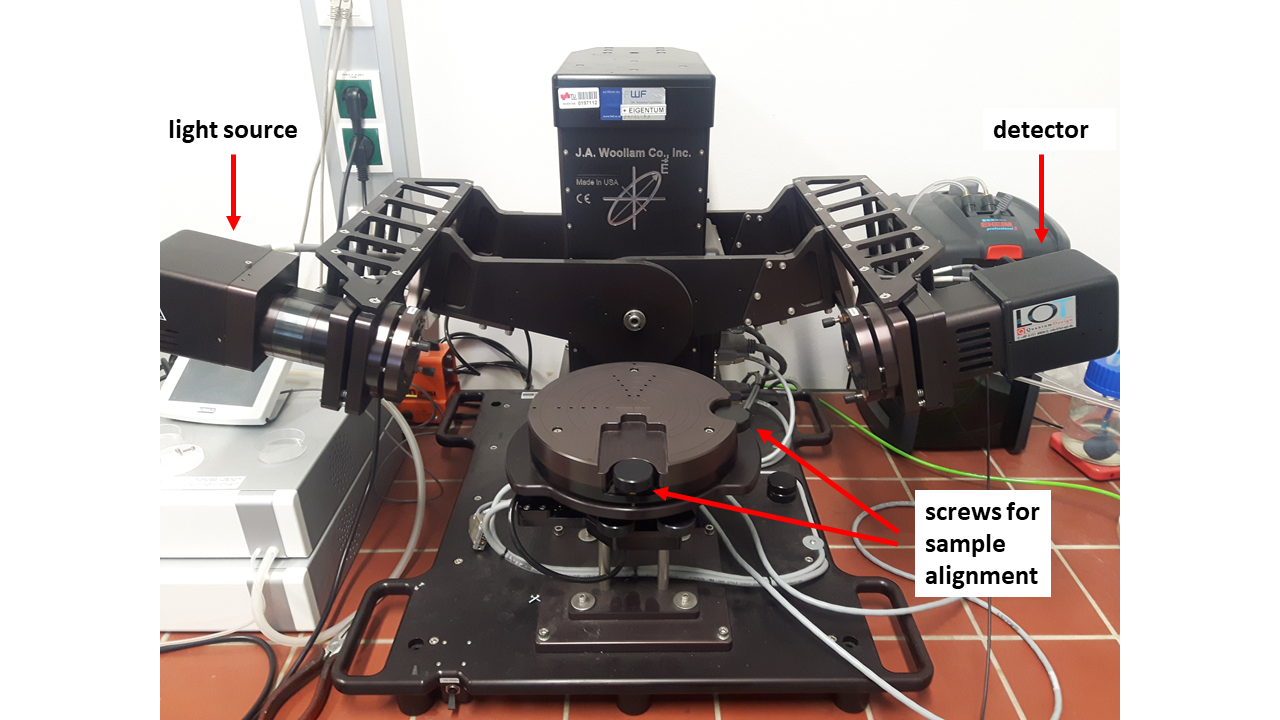
J.A. Woollam M-2000V Spectroscopic Ellipsometer
Spectroscopic ellipsometry is a measurement technique that can be used to determine the optical constants of thin films as well as their thicknesses and surface roughness.
Theoretical background
When light is reflected from a, in general, multilayer system, it changes its polarization state. This is described by Fresnel’s equations and depends on the angle of incidence $\theta$ and the thicknesses and complex refractive indices $(N = n-ik)$ of all layers. In spectroscopic ellipsometry, linearly polarized light is shone onto the sample and the polarization state of the reflected light is measured and described by the ellipsometric parameters psi ($\Psi$) and delta ($\Delta$),
$$\tan(\Psi) \exp{i \Delta} = \frac{r_p}{r_s}$$
where $r_p$ and $r_s$ are the complex Fresnel reflection coefficients for light polarized parallel and perpendicular to the plane-of-incidence. Thus, $\tan(\Psi)$ describes the amplitude ratio of p- and s-polarized light and $\Delta$ the phase shift.
Data modelling
In general, $\Psi$ and $\Delta$ cannot be directly used to calculate the properties of the sample. In order to determine the optical constants and thicknesses of the individual layers, a model-based analysis needs to be performed (e.g. using the software package CompleteEASE). This involves the creation of a model whose parameters are then optimized by a fitting procedure to obtain agreement between experimental and theoretical data. For transparent thin films, a well-known and simple mathematical model to describe the refractive index $n(\lambda)$ of a layer is the Cauchy model,
$$n(\lambda) = A + \frac{B}{\lambda^2}+\frac{C}{\lambda^3}$$
where $A$, $B$ and $C$ are fit parameters that control the shape of $n(\lambda)$.
Step-by-step guide
Measurement
- Turn on the power supply and the electronics control module (lower two modules in box beneath ellipsometer)
- On the computer, open the software ‘CompleteEASE’.
- Wait until initialization of ellipsometer is finished (System status: Waiting to acquire data).
- Place your sample into the center of the sample stage.
- In CompleteEASE, in the tab ‘Measurement’ choose "Recipe: <Prompt for Acquisition Data>" and check the box “Save Data after Measurement”.
- Click on "Measure". A window pops up where you can choose a filename and location for data saving. Then click "OK".
- The window "Acquisition Parameters Setup" pops up. For standard measurements, default parameters are fine (see image). Click "OK".
- Sample Alignment Screen pops up. Adjust tip and tilt of sample stage by turning the 2 large, black screws at the stage until red cross is centered. Intensity should be roughly 1. Click on "Close alignment screen".
- Measurement starts automatically and data is saved to chosen location.
Data fitting for a transparent thin film on Si + Native Oxide
- In CompleteEASE, open the "Analysis" tab.
- In the left upper corner, select "Open" to open a data file.
- In the model section, select "Open" to import an existing model (e.g. from the Software library). For Si + native oxide choose "…\Library\Basic\Silicon with native oxide.mod".
- Click on "Layer Commands: Add" to add another layer for the transparent thin film. As a mathematical model, choose "…\Library\Basic\Cauchy.mat". By left-clicking onto the values of the layer thickness and its Cauchy parameters you can manually enter a number, by right-clicking you can toggle whether the parameter will be fitted or kept fixed. In most cases, fitting the parameters A & B of the Cauchy model and keeping C = 0 is sufficient to get a good approximation for the optical properties of the investigated material.
- After entering starting values and selecting which parameters should be fitted by the software, clicking on "Fit" will start the fitting procedure. Results are displayed in the white area below. MSE (Mean square error) indicates the goodness of fit (MSE < 4 for really good fits).
- Play around with the parameters until you are satisfied with the results. You can also try including surface roughness into the model.
- You can change which parameters are displayed in the graph by right-clicking onto "Graph Type".
- You can copy your model or the graph to the clipboard by righ-clicking and selecting "Copy graph/model to clipboard".
- CompleteEASE Training Videos
- Wikipedia article: Ellipsometry
- J.A. Woollam - Ellipsometry Tutorial
- J.A. Woollam - Ellipsometry FAQ
- J.A. Woollam - Reference Books
- Optical properties of materials from the Advanced Solid State Physics course
|