Semiconductor Laboratory
|
|
Semiconductor Laboratory | |
|
|
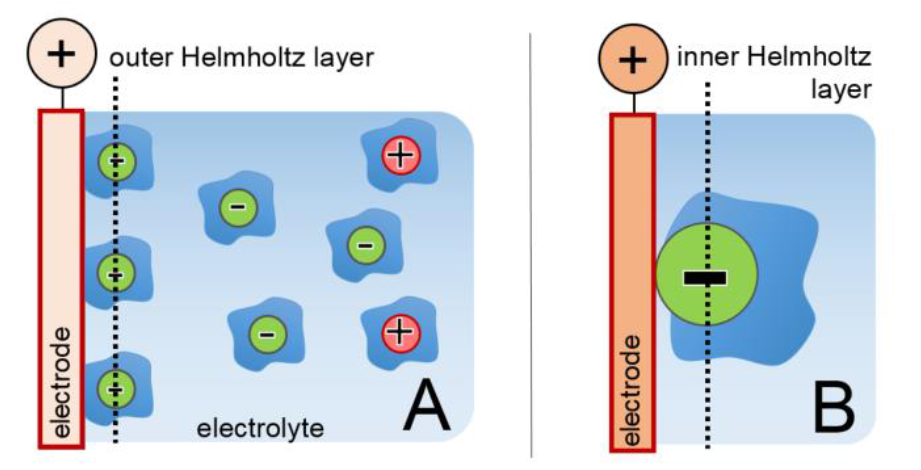
Electrochemistry and Electrochemical MethodsElectrochemical characterization of basic processes in materials for energy storage - Video The phase boundary between a (liquid) electrolyte and an immersed (solid metal) electrode also represents a boundary between regions with different conduction mechanisms and charge carrier concentrations: while in the electrolyte charge is carried by dissolved ions of different sign, in the metal we find free (negative) electrons and fixed (positive) ionic cores. Depending on the system, a variety of interactions can take place between these phases. The term 'electrochemical reaction' summarizes all redox reactions in which charge is transferred across the interface. Since no potential can be assigned to a single redox couple, but only potential differences between two couples can be measured, a general reference point has to be determined for the comparison of different reactions. The electrochemical series is based on the standard hydrogen electrode (SHE) with the redox system H2 + 2 H2O ↔ H3O+ + 2 e- which is associated with an (arbitrarily chosen) potential of 0 V. The equilibrium potential of a redox couple $\varphi_0$ is dependent on the concentration of the electrolytic components involved and can be described by the Nernst equation $$\varphi_0 = \varphi_{00}+\frac{RT}{nF}\ln\left(\frac{a_{\text{ox}}}{a_{\text{red}}}\right)$$with the standard potential $\varphi_{00}$, the gas constant $R$, the Faraday constant $F$, the valence $n$ of the ionic species and the temperature $T$. The activities $a_i$ of the involved components can usually be approximated by the respective concentrations. The concentration of a pure, solid phase (e.g. metal electrode) equals one per definition. In general, due to the electrochemical potential difference between the electrode and the electrolyte, regions of opposite charge accumulation will form on both sides of the interface, the so-called electrochemical double layer (see figure 1A), even if no external potential is applied to the system. Due to the excellent conductivity of a metal (high density of small, mobile electrons), the excess charge in the electrode is confined to a narrow surface layer with a thickness of no more than about 1 Å. The charge carrier concentration in the electrolyte (at common concentrations between $10^{-3}$ and 1 mol/l) is by orders of magnitude smaller, which leads to a significantly wider spread double layer in the solution, typically between 5 and 20 Å. [1] In the electrochemical double layer regime no charge is transferred across the interface and the system electrolyte-electrode can be considered similar to a capacitor, which exhibits a linear relationship between applied potential and stored charge. In a simplified model (Helmholtz model) the electrode surface can be considered as covered by a rigid ionic layer, separated by the solvation shell of the ions. The plane carrying the centers of the solvatized ions is accordingly called the outer Helmholtz plane (see figure 1A).
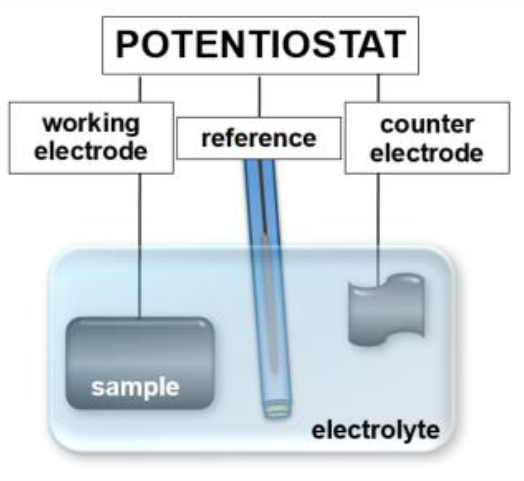
Most electrochemical reactions, characterized by charge transfer across the interface, involve an ionic adsorption step. For an ion, solvatized in an electrolyte, to 'specifically adsorb' at least partially it has to strip off its solvation shell which is illustrated in figure 1 B. Specific adsorption is particularly favorable for anions due to their larger ionic radii and therefore weaker bound solvation shells. The plane passing through the specifically adsorbed species is called the inner Helmholtz plane accordingly. Electrochemical experiments are usually performed in three electrode geometry. The sample material, immersed in the electrolyte, is controlled as the working electrode (WE) of a potentiostat, which is sketched in figure 2. Since standard hydrogen electrodes (SHE) are difficult to handle, the potential is usually measured relative to other reference systems with a well-known, stable potential relative to SHE which are commercially available in many different designs. One of the most common reference electrodes is the Ag/AgCl system [2], based on the half cell reaction Ag(s) + Cl-(aq) ↔ AgCl(s) + e- In saturated KCl solution the potential of this electrode is approximately +200 mV at room temperature. The potential recorded between the working and the reference electrode without external charging is called open circuit potential (OCP). If a potential of the WE other than the OCP is to be adjusted, a third electrode, the counter electrode (CE), is required since currents between the sample and the reference electrode are undesirable. The measurements are performed using a potentiostat, which controls the potentials and currents flowing in the system. Many different measurement modes are possible. The most frequently used modes are chronoamperometry (CA) and chronopotentiometry (CP), where the potential or current are kept at a constant value for a defined time respectively, as well as cyclic voltammetry, where the applied potential is varied at a certain rate $|dU/dt| = \text{const}$ with triangular characteristics. In all cases current and potential are recorded as a function of time and plotted according to the respective mode.
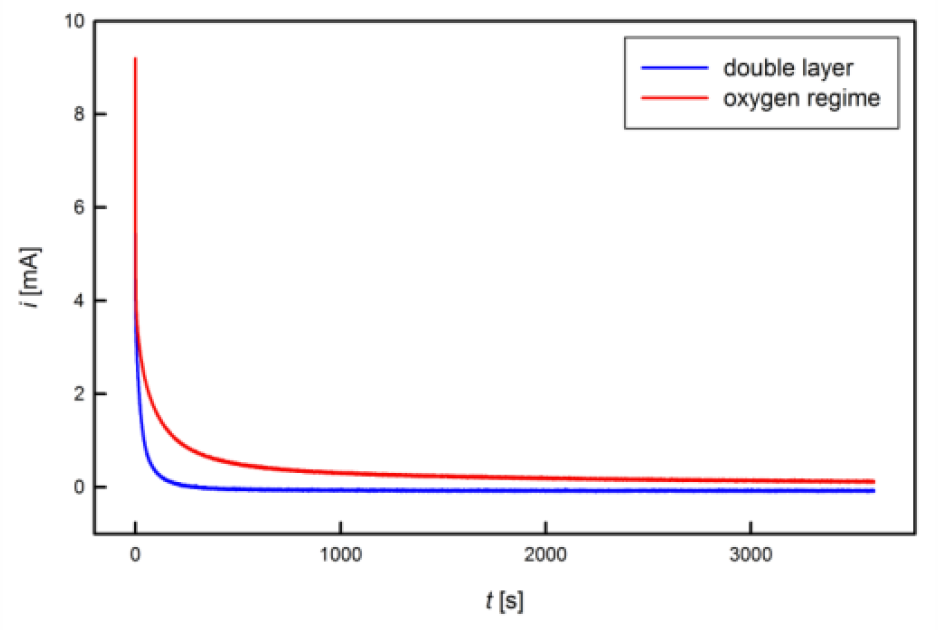
ChronoamperometryIn chronoamperometry mode (CA) the potential of the working electrode (sample) is set to a constant value. The current $i$ is recorded while the sample approaches an equilibrium state. The current characteristics of a CA step show an approximately exponential behavior, comparable to the charging characteristics of a capacitor.
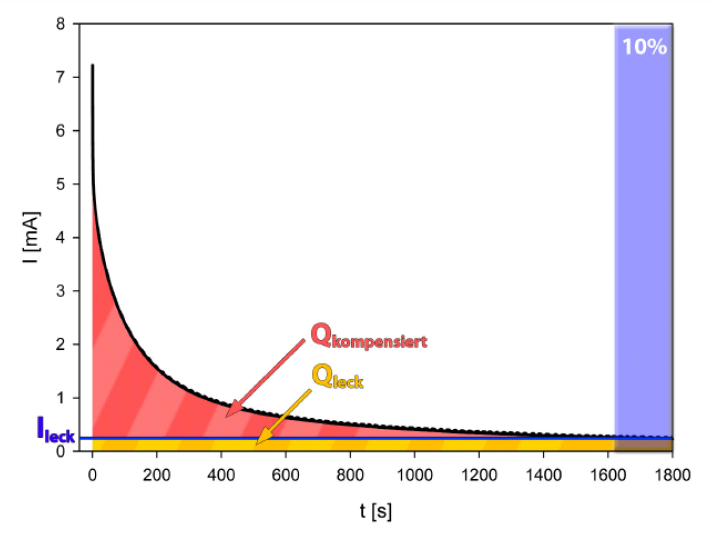
Different chemical regimes can clearly be distinguished by the time constants of charging, which is illustrated in figure 3. In the double layer regime (blue), which is characterized by shifts in the charge carrier density with no charge transfer across the interface similar to an electrical capacitor, the charging current rapidly decays, whereas in the oxygen regime (red), associated with chemical reactions at the solid-electrolyte interface with a concomitant charge exchange, longer charging times and higher currents are recorded. One major advantage of chronoamperometric measurements is the correction of leakage currents, which is illustrated in figure 4. In contrast to the theoretically expected exponential decay of the charging current towards zero, experimentally a leakage rather than zero current is reached finally, regardless of the sample, charging time or potential used. Such a leakage current, which is caused by chemical electrode reactions and/or electrolysis, is present also in other electrochemical methods, such as CV, however superimposed to the (usually higher) measurement current. Since this leakage current does not contribute to the charge transfer associated with the investigated process, it should be subtracted from the recorded signal for an accurate charge determination. In an idealized correction for a CA measurement with the duration $t_{\text{max}}$, the transferred charge $$Q=\int\limits_{0}^{t_{\text{max}}}\left( i(t)-\lim\limits_{t\rightarrow \infty} i \right)dt$$is determined by subtracting the leakage limiting value for extended times from the recorded current before integration. In practice a CA measurement is stopped after a measurement time $t_{\text{max}}$, when the current signal $i$ has faded to a flat line, exhibiting variations only due to noise. The average value $i_{\text{leak}}$, recorded for the current at times $t$ between $0.9t_{\text{max}}$ and $t_{\text{max}}$, is assigned to leakages. The corrected charge $Q_{\text{corr}}$ is then calculated as $$Q_{\text{corr}}= Q_{\text{total}}-\overline{i_{\text{leak}}t_{\text{max}}}\qquad\text{with}\qquad Q_{\text{total}}=\int\limits_{0}^{t_{\text{max}}} i(t)dt$$
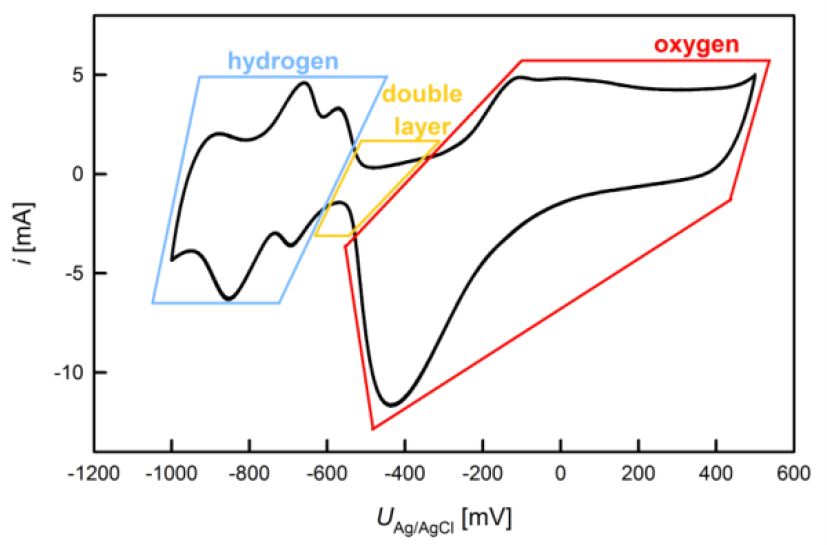
Cyclic VoltammetryDuring cyclic voltammetry (CV) the potential of the working electrode is varied in triangular characteristics with a constant scan rate $s=dU/dt$ [mV/s] between an upper and a lower limit. This method gives an overview of the electrochemical behavior of the studied material as a function of $U$, allowing to distinguish between double layer and chemically active regimes. Figure 5 shows an exemplary cyclic voltammogram, which is run through in clockwise direction.
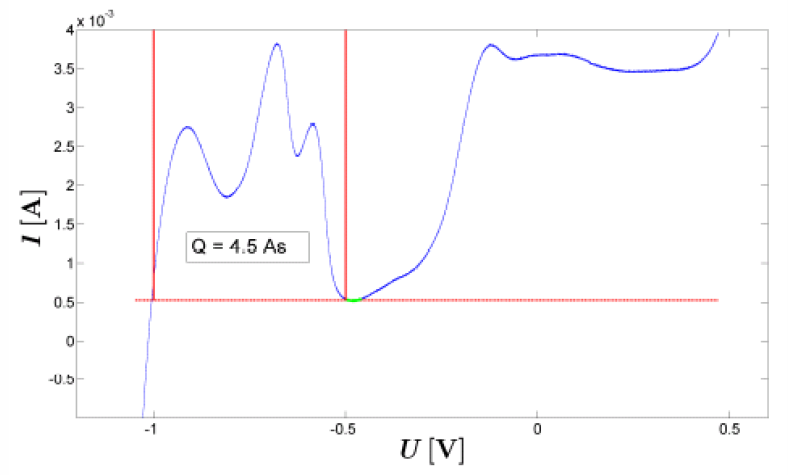
In order to achieve reproducable electrochemical results, a working electrode is usually activated by repeated CV cycling prior to an actual measurement. The activation is performed until stable conditions of a steady state are achieved which is the case when successive cycles can no longer be discerned. For a calculation of the charge flow during a cyclic voltammogram the scan rate has to be taken account. Moreover, for the investigation of chemical reactions, the contribution of the double layer current should be subtracted from the signal [4] as illustrated below in figure 6. Electrochemical Surface Area DeterminationNanostructures exhibit special properties due to a particuliarly high surface-to-volume ratio compared to conventional materials. In the following two different electrochemical methods for the determination of the active surface area are presented using the example of nanocrystalline platinum. 1) Specific Ad-/Desorption
2) Double Layer Capacitance Therefore, a plot of the current as a function of $s$ should resemble a line with a slope determined by the sample surface area, which in the following can be calculated if the double layer capacitance of the respective material is known. The double layer capacitance of Pt is $C^d =$ 73 μF/cm² [8]. Literature[1] W. Schmickler, Grundlagen der Elektrochemie, Vieweg Lehrbuch Physikalische Chemie, Braunschweig/Wiesbaden 1996 [2] H. Kaden, W. Vonau, Bezugselektroden für elektrochemische Messungen, J. prakt. Chem. 340 (1998) 710 [3] P. Wahl, Durchstimmbarer elektrischer Widerstand von nanoporösem Gold, Masterarbeit, TU Graz, Institut für Materialphysik (2010) [4] B. Conway, Electrochemical oxide film formation at noble-metals as a surface-chemical process, Progress in Surface Science 49 (1995) 33 [7] C. Hamann, W. Vielstich, Elektrochemie, Wiley-VCH, Weinheim, 2005 |